 The chancellor claimed that the public service cuts outlined in the Comprehensive Spending Review would be based on fairness and that cuts would be shared equally in an attempt to protect the most vulnerable in our society. Yet research finds that the single parent families will be one of the worst affected groups, facing services cuts equivalent to over 10 per cent of their household income. With 9 out of 10 single parent families headed by women, Amy Mollett examines how poor mothers stand to lose the most when services are cut.
Before the Comprehensive Spending Review was formally announced, the Trade Unions Congress found that the government’s proposed £34 billion cuts to public service would hit the poorest in Britain ten times harder than the richest. By combining Treasury data on health, education, and transport spending with data from surveys such as the British Crime Survey and the Family Resources Survey, the study revealed that different types of households will experience losses to services at starkly varying degrees, as shown in Figure 1.
Figure 1: The distributional impact of Government’s proposed spending cuts (excluding benefit cuts) by household type, 2012-2013
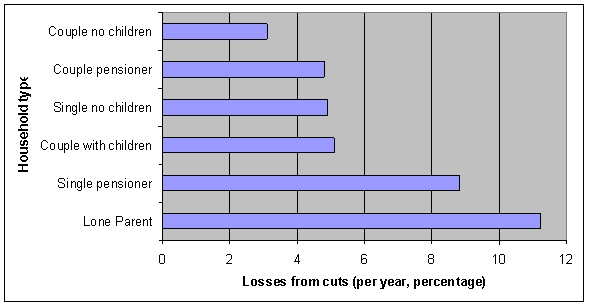 Source: adapted from Where The Money Goes, TUC (2010).
The figure shows that a couple with no children stands to lose the services equivalent to 3 per cent of their net household income, or approximately £817 a year, whilst couples with children look to lose services equivalent to 5.1 per cent, or approximately £1,012 a year. It is lone parents however who stand out as losing the most across all household groups, by missing out on services equivalent to 11.2 per cent of their net household income, which is more than double that of two parent families. In cash terms this means that single parent families may lose up to £1,900 worth of services per year, with the major losses being felt in education, housing and social care. So far the coalition has not outlined how it will ameliorate poverty for single parent families. Raising the income tax threshold by £1,000 will save basic rate tax payers little more than £170 a year, which will not cover even 10 per cent of the equivalent services lost.
Throughout Britain, a high proportion of single parent families are already in situations of severe financial vulnerability. Figures produced for the Department of Work & Pensions reveal that 51 per cent of people living in single parent families fall into the low-income bracket, which is defined as below 60 per cent of the national median income after deducting housing costs (approximately £195 per week for a single parent with children). In contrast, less than 5 per cent of two parent families fall into this category. Additionally, as Figure 2 demonstrates, single parent families in Britain experience some of the highest poverty rates across Europe.
Figure 2: ‘At risk’ rates for single parents with dependent children, across a selection of EU countries
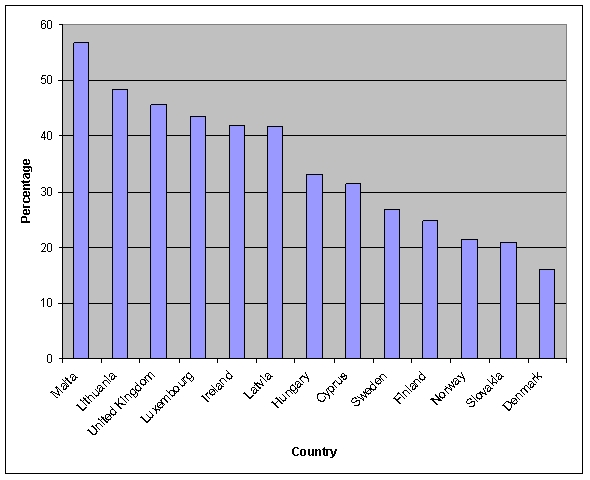 Source: Eurostat
Between 2006 and 2008, single parent families in Britain faced poverty ‘risk rates’ of 45.6 per cent, the third highest after Malta at 56.8 per cent and Lithuania at 48.3 per cent. The Nordic states, famed for their values of equality, inclusion and universalism, observe the lowest levels of single parent poverty risk at between 16 per cent for Denmark and 26.8 per cent for Sweden. Rather than aiming to achieve similarly low levels of single-parent poverty in Britain, it appears the government’s plans will force families to delve deeper into their pockets than other families to compensate for service losses.
There is a strong gender component to the impact of public services cuts. In Britain, 91 per cent of single parents are women, suggesting that single mothers experience poverty and deprivation at much higher rates than single fathers. Single mothers are also overwhelming employed in part time, low paid, or public sector employment, and will therefore also be affected badly by pay freezes and the massive public sector job losses.
Single parent families will suffer disproportionately not only under cuts to public services but also under tax increases and benefit changes. A gender audit of June’s emergency budget undertaken by shadow welfare secretary Yvette Cooper found that of the £8bn net personal tax increases and benefit cuts expected be made by the financial year 2014-2015, an estimated £5.8bn will be paid for by women, whereas £2.2bn will be paid for by men. Figure 3 breaks down the expected savings to be made on benefits and credits by the claimant’s sex.
Figure 3: Amounts to be raised by 2014-2015 from a selection of benefits and tax credits, by sex of claimants
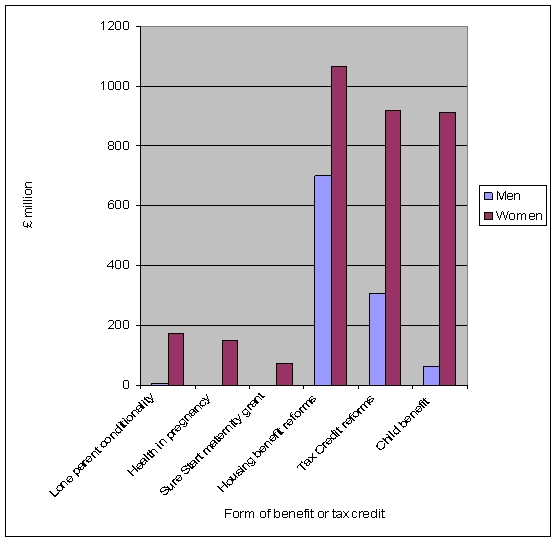
We see that the split falls 72.5 per cent on services which women use and fund, with 27.5 per cent of the savings to be made through services used and funded by men. Services used exclusively by low income and single mothers will be hit especially hard; cuts to the Sure Start maternity grant worth £75m or £500 per family, coupled with the abolition of the Health in Pregnancy grant worth £150m or £190 per family could contribute to higher rates of maternal mortality and morbidity, which are already three times higher for single mothers than married women in the UK. Major reductions in child benefit and tax credits could also severely increase the financial burden for low income and single mothers.
It is clear that single parent families, especially those headed by women, are at risk of becoming even more vulnerable to poverty under the coalition’s spending cuts and benefit reforms. It seems neither fair nor equal to cut services to vulnerable who will be hit the hardest, and from multiple directions.
Click here to respond to this post.
Please read our comments policy before posting.


as a victim and survivor of domestic violence and now rebuilding my life, how sickened I was when I heard of my ex partner, who with the label of anti social behavioral disorder bestowed on him by the court after they made him undergo testing, is now able to claim E.S.A for life. they pay his mortgages(2) and he does not have to sign on or work ever, or pay towards his child. There is nothing physically wrong with him or others like him, except that they are violent and abusive. Surely this is a loophole that needs to be closed immediately. Please join the crusade of abused women fighting for justice over this issue.
The government think all us single parents are single because we want to be single.
This is so not the case. Various reasons for different people. Some victims of violence, some by choice, relationship break down my youngest has allergies to food and asthmatic, school continuously muck up. Oldest Disabled and no local high school available. Job centre just say go to work. I am so in debt trying to pay for childcare
like many more sod the government, lets see them not claim for second properties, fuel expences, etc. That will be the day. It makes me so cross.
I’m so there with you. I’m too a single parent. I have 5 children, all by the same father and they were conceived in wed-lock while we were together, and both worked. Not all single parents are ‘benefit scroungers,’ yet- its seems, we are all tarred with the same brush. Isn’t it ironic that the ruling factors of this world (men) have made the decision to yet again target mothers. It’s disgusting that not only do the most vaunrable women of this country have to suffer, but the children too. Why not just round us all up and shove us in a concentration camp. Hitler might just have well taken over. The freedoms we fought for, are being stripped from us.
Saying this… I’ve been looking for low cost childcare I can afford. And a job for 2 years. Each time, I’ve been told I’m £90 worse off per week. It’s not that I don’t wish to work, but the fact it’s impossible to survive on one income with 5 children. When I am forced back to work 16 hours a week… I will also lose help with my mortage, so in conclusion I’m forced to sell my children’s home. My children are well raised, know right from wrong and bright. They are no menace to society. But as the changes happen, I fear they will go with out the very bare essentials they need, and become bitter in the poverty they are facing.
What better? Well raised children who will try in society, or children who get desperate and thieve from the rich to live? Sound extreme? Maybe. But it could become a chilling reality.
Amy
I am student from Staffordshire University and I am currently writing a feature on the benefit cuts and how they will affect single mothers, I would be interested in speaking to you regarding the information you have provided above.
Hannah
Nick Clegg made a speech recently in which he said this government would not be myopic. In fact he mentioned the wicked myopia in relation to Condem policy about a zillion times. Or something like that.
The point is, the full impact of cuts to public services, welfare cuts and grant abolition isn’t going to be felt properly for some time. This study is useful in detailing exactly how single mothers will be worst hit immediately (even though many of us single mums have known that for some time), but when you add in impacts five years down the road, things get apocalyptic.
If my kids, for example, do go to Uni in the next few years and take on up to £50k debt each (including living costs), there’s no way they’re going to be able to pay that back and pay rent. They will do what all graduates will be doing in the next decade. They’ll move back with their parents. For single mothers, re-homing our graduate kids three years after all financial support and maintenance has disappeared isn’t only going to be financially ‘difficult’, it’s going to be absolutely impossible.
Please expand these studies by modelling what could happen in the future. Then go get Clegg a pair of glasses. And a dictionary. I know what myopic means even if Clegg doesn’t. It’s currently being played out beautifully through cuts and tuition fee increases.
If single mothers didn’t feel victimised up to now, by encouraging their kids to do well, they’re going to in the near future. Couple this long-term impact with child benefit freezes, tax breaks for married couples and the cuts mentioned here, and anyone would think we’re not wanted in society. What this government is doing to single mothers is wicked. There are nearly 2 million of us in the UK. What’s going to happen when we get as angry as the students?
“In Britain, 91 per cent of single parents are women, suggesting that single mothers experience poverty and deprivation at much higher rates than single fathers.”
Both halves of this sentence are doubtless true but don’t necessarily follow. Please can you clarify.