 Today saw the announcement of 0.6 per cent GDP growth for the second quarter of this year, leading the Chancellor, George Osborne, to claim that the economy is now ‘on the mend’. John Van Reenen takes a close look at these claims, finding that the UK’s economic indicators are by no means in the best of health. A dislocated financial sector and the UK and Eurozone’s austerity policies mean that the UK is in the midst of the longest depression in a century. He argues that for the UK to get back on the path to sustainable growth, there needs to be greater investment in public infrastructure and structural reforms to raise the UK’s productivity and increase investment.
A long march to the Sunny Uplands?
In the last few weeks the UK has enjoyed some much-desired warm weather and some much-needed signs of an economic upturn. This has lifted the mood of the nation as well as the tenants of Downing Street. The Chancellor described the UK economy as a “patient coming out of intensive care”, presumably thanks to the skilful care of Dr. Osborne, who is proud to have his performance recorded on the new NHS database of economic surgeons.
It feels curmudgeonly to pour cold water on this sunny disposition. Unfortunately, the IMF’s recent uprating of Britain’s predicted growth in 2013 was only from a miserly 0.7% to a meagre 0.9%. The excitement over NIESR’s 0.6% 2013Q2 GDP growth prediction shows our lack of ambition. The average growth rate over the last couple of centuries has averaged over 2%, so this is not a standard “recovery” where we expect growth to be substantially above this long-run average.
Cold Hard Fact No 1: Lousy Output levels
The ONS recently revised their figures of national output since the recession. It made grim reading. Popular attention focused on the economically irrelevant statistical revision that abolished the “double dip recession”. The brute fact is that UK GDP is estimated to be 3.9% below where it was pre-crisis in 2008 rather than 2.6% as previously thought. We are as a national economy around 14% smaller than we should be based on past trends. This is the longest depression for over a Century (Figure 1).
Figure 1: UK still in the worst recovery for 100 years
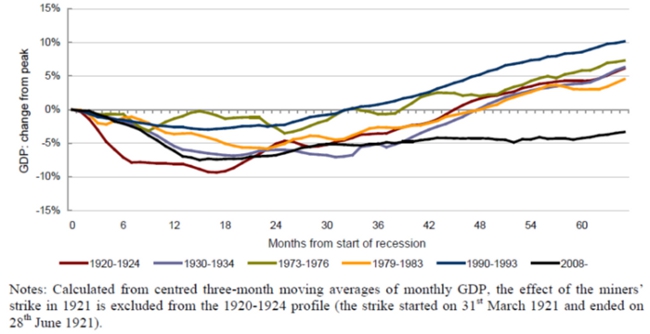
Source: NIESR
But what about the fact that we have more jobs than in 2008 – doesn’t this prove the nay-sayers wrong? Part of the employment growth is due to increases in the working age population. Employment as a proportion of this population has fallen (Figure 2) and there is widespread under-employment with more people saying they want to work more hours at the same wage, but cannot due to lack of demand. This is reflected in the fall in average hours worked since the crisis.
Figure 2: Employment Rate has fallen since start of crisis
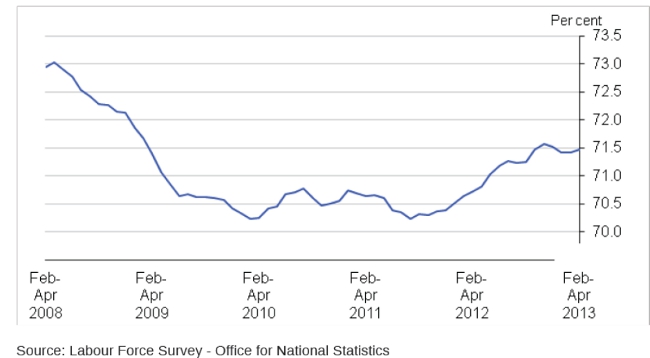
Source: ONS
Note: Proportion of working age population (aged 16 to 64 years old) in jobs
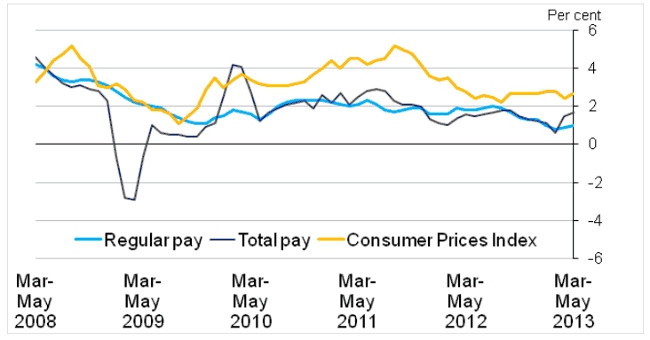
Nevertheless, unemployment remains at 7.8% whereas we would have expected double digit joblessness given how sluggish growth has been. Low unemployment is testament to the flexibility of the UK labour market. Real wages have fallen by about 9% (see Figure 3) since 2008 due to three decades of reform that have simultaneously kept the pressure on benefit claimants and weakened the ability of trade unions to maintain real wages even during recessions, as has happened in the past. But although some job is better than no job, miserable wages are not the path to long-run economic health.
Figure 3: Inflation rises faster than pay so real wages have fallen since crisis
 Source: ONS
Notes:
1. This chart shows monthly estimates for the Consumer Prices Index (CPI) from May 2008 to May 2013 and three month average estimates for Average Weekly Earnings (AWE) from March-May 2008 to March-May 2013.
2. The CPI series is for the United Kingdom and is compiled from prices data based on a large and representative selection of individual goods and services. The AWE series are for Great Britain and are sourced from the Monthly Wages and Salaries Survey.
3. The AWE series are seasonally adjusted. The CPI series is not seasonally adjusted.
Why is the economy in the doldrums?
Two big factors lie behind the poor overall output numbers. First, the financial sector remains dislocated. The US has dealt much more aggressively with the problem of bad loans and is now enjoying a stronger recovery. UK (and European) Banks remain reluctant to lend as they re-build their balance sheets and are not enforcing covenants over bad loans. This forbearance has meant less insolvency and more jobs in the short-run, but creates “zombie firms” who would exit in normal times. Low rates of new lending hits new firms with high growth potential particularly hard, which shores up problem in the future. Much productivity growth comes from start-ups with innovative ideas. Second, the blast of austerity unleashed in the UK and Eurozone has depressed demand. The 40% cuts in British public investment have been hugely counter-productive. Rather than taking advantage of low interest rates and spare resources to rebuild much needed- infrastructure, the UK government and its predecessor did the opposite. The underestimation of the impact of austerity on output (the “fiscal multiplier”) when interest rates are near zero has, as the IMF and others have pointed out, substantially reduced growth in the UK and other austerity minded nations.
The upshot of these twin evils has been an investment collapse (Figure 4). Business Investment is now 30% lower than what it was in 2007. This capital shallowing is reflected in the productivity puzzle: UK GDP per hour has not recovered as it did in previous recessions. A big part of this is because low capital per worker means low output per worker.
Figure 4: The Collapse of UK Investment
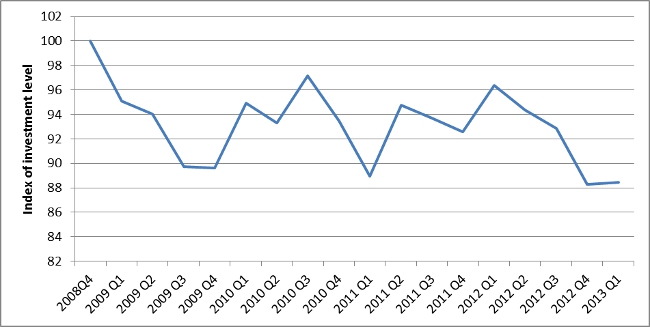
Source: 2008Q4=100, ONS
Note: This is nominal GFCF. The investment fall is even greater in real terms.
An unbalanced recovery
The government’s has argued that much of the pre-crisis growth was unbalanced. There was too much consumption and not enough investment and exports; the property sector boomed but manufacturing shrank; London and the South-East grew too fast compared to the regions.
So although things are improving too slowly, at least the growth is more balanced, right? Wrong. The green shoots we are seeing are once again in the same old places. Consumption is picking up, but investment remains poor; services grow but manufacturing continues to decline (Figure 5); the trade deficit is large (Figure 6) despite a huge sterling depreciation and there is no sign of relatively faster growth outside the South East golden triangle. Households saved 4.2% of their income in the first quarter of 2013: down from 7.4% the year before and the lowest in four years. There is a mini-boom going on in house prices and mortgages stimulated by the government’s Funding for Lending and Help to Buy Schemes. A feel-good factor in the housing market may be good for votes come 2015, but stimulating demand is only feeding into house prices rather than increasing housing supply. Supply is held back by structural problems with planning and this major UK problem is not being dealt with.
None of this bodes well – a feeble recovery without any of the promised rebalancing. Plus ca la change.
Figure 5: Output growth in services, shrinkage in manufacturing
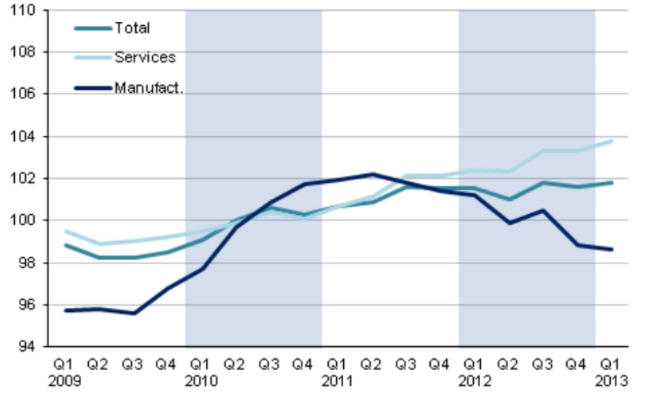
Source: ONS
Figure 6: Net trade balance – in the red
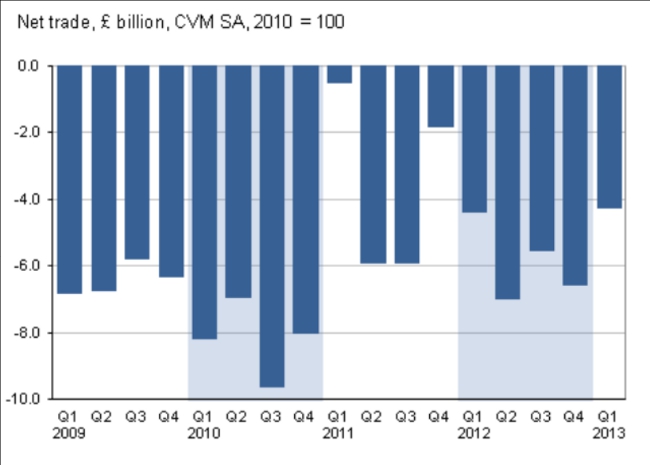
Source: ONS
What should be done?
In the near term, addressing the dysfunctional banks requires both better regulation and splitting RBS into a “good bank” and “bad bank”. There needs to be a reversal of the severe cuts in public investment especially around infrastructure – the government’s current plans are far too timid and stretched too far into the future.
The second priority is structural reform to raise long-run levels of UK investment and productivity. As the LSE Growth Commission highlighted, this is especially true in human capital, infrastructure and innovation. Many of these reforms require spending political capital rather than taxpayers’ money. Infrastructure could be revolutionised by adequately sharing the gains in planning (rather than having losers fight things out in interminable Judicial Reviews and Planning Inquiries) and institutionally removing ministerial fiddling and procrastination. Innovation would be stimulated by injecting some proper competition into the banking system through de-concentration. And human capital would be expanding by having schools focus on the long lower tail of under-achievement instead of meeting targets which cause schools to focus on pushing marginal students over arbitrary thresholds.
I hope that the recovery persists. But a sustained path for growth for the UK economy will remain elusive until tough political decisions are made over short-run and long-run economic policies.
This article was originally commissioned by The Economist.
Note: This article gives the views of the author, and not the position of the British Politics and Policy blog, nor of the London School of Economics. Please read our comments policy before posting.
About the Author
John Van Reenen is Director of the Centre for Economic Performance at the London School of Economics.


1 Comments