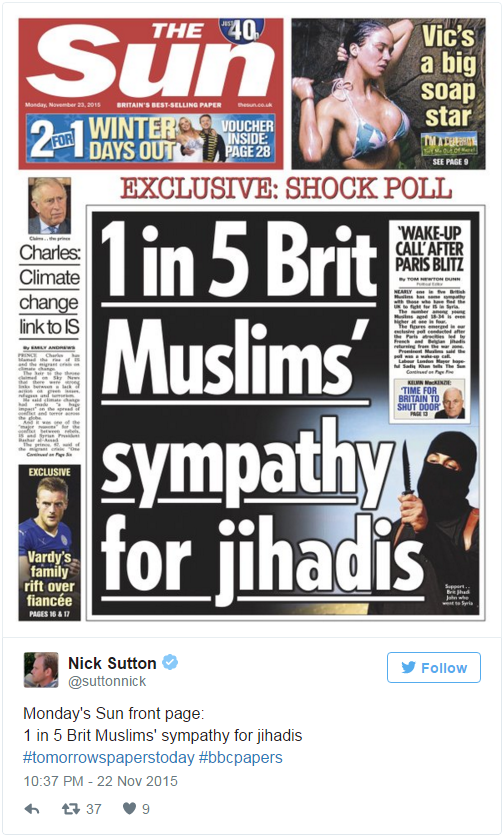
The first thing to say is that getting a representative sample of any population is difficult. As I highlighted last week in my analysis of why the polls were wrong at the election, sampling and weighting are now prime suspects for the polling failure in May.
But polling of a particular group within a population is even more problematic. The tables give a breakdown by age, gender and region though it wasn’t entirely clear whether these have been used for weighting. But if we want to reflect accurately the views of Britain’s Muslim community, we need to look at other variables too – do we have a representative sample in terms of denomination and country of origin? What about those living in places where the population is overwhelmingly Muslim versus those in more diverse areas?
It’s also unclear what sampling method was used. The tables refer to a “modelled probability of residents describing themselves as Muslim”. It’s not entirely clear what that involves, but it’s well known that telephone polling can involve selection bias due to the wildly differing coverage of landlines between age groups. This bias is understood to some extent in respect of the wider population, but do we have an accurate handle on the demographics of land line coverage among British Muslims? As land line users are typically older than average and British Muslims typically younger, the risk is that the problems there are even worse.
Then once you’ve got your sample, what do you ask? Question wording can, as always, have a huge impact. In this case, the question is vague – it mentions “sympathy”, which is rather broad. Most people would use “sympathise” in an emotional sense, not the political or ideological sense.
The question is also asked with reference to “fighters”. Many (if not most) people will be aware that there are a number of groups fighting in Syria of which the “Jihadis” are just one. Because the question doesn’t mention any group(s) directly, those fighting against IS/ISIS/ISIL/Daesh could also fall within the respondent’s interpretation of the question.
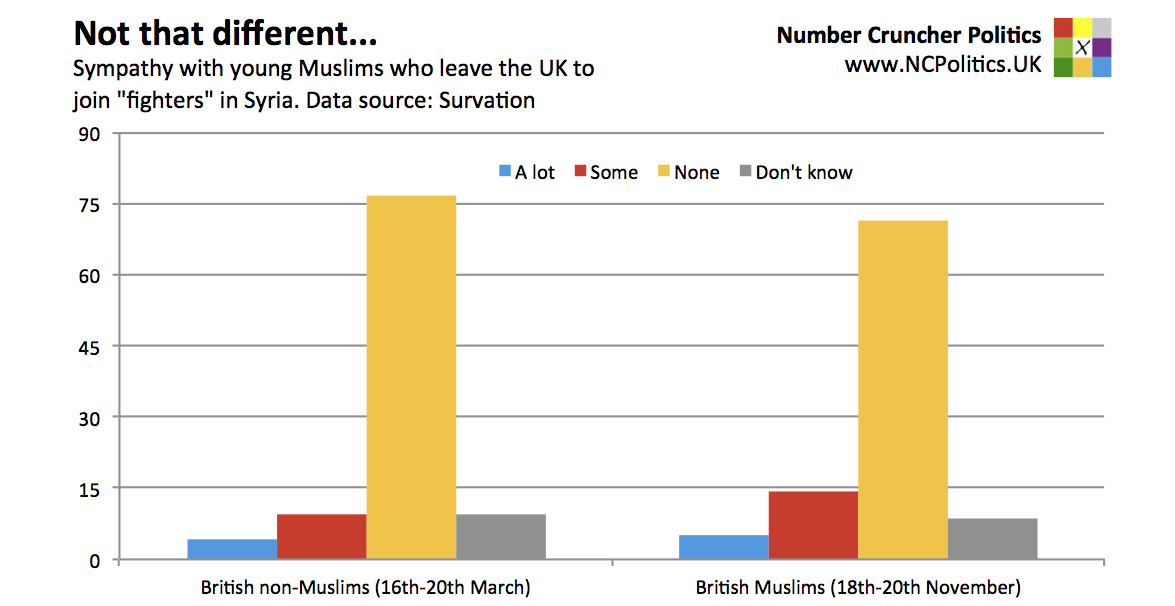
We also need to be careful interpreting the results and where applicable, look at control groups. To take a more common example, a certain percentage of a particular party’s voters may hold a certain view. But what about the supporters of other parties, or those that don’t vote? In this case, what do non-Muslim British people think? The evidence in general suggests that public opinion is less clear-cut than is commonly assumed. Maria Sobolewska of the University of Manchester has done quite a lot of work on comparative attitudes. And in fact it turns out that Survation also asked this question to non-Muslims in March (thanks to Will Jennings for pointing this out). That poll found that 14% of British non-Muslims had sympathy with young Muslims leaving the UK to join “fighters” in Syria.
So you have a highly specific interpretation of a vaguely-worded question asked to a sample that’s difficult to begin with. Is it wrong to ask these questions? No. But a lot of care needs to be taken in doing so and especially in interpreting the findings.
__
Note: a version of this article originally appeared at Number Cruncher Politics and is reproduced here with kind permission of the author. The article represents the views of the author and not those of British Politics and Policy, nor the LSE. Please read our comments policy before posting.
__
About the Author
 Matt Singh runs Number Cruncher Politics, a non-partisan psephology and polling blog. He tweets at @MattSingh_ and Number Cruncher Politics can be found at @NCPoliticsUK.


