Carl Cullinane discusses how individual universities are contributing to social mobility, and finds that gaps in access are hugely variable depending on university selectivity. The most selective universities admitted comparatively low numbers from less well-off backgrounds but those students had extremely high success rates. Post-1992 institutions, however, took on much larger numbers of those from backgrounds.
Universities are extensively rated and ranked across a range of measures by a variety of different media outlets and organisations. However, few of these reflect universities’ role in widening access to opportunities. In fact, many measures used to rank universities actively disincentivise taking on more diverse populations, with under-represented groups often more likely to drop out or have lower outcomes, in part because of the wider circumstances they face in their lives.
A common measure in UK university rankings is tariff score on entry. This rewards universities for taking on more high attaining students, rather than on the education they provide to those who attend. This punishes universities for contextualising admissions by taking on applicants with lower grades they have nonetheless achieved in the face of greater obstacles. At a time when the role of higher education is under greater scrutiny than ever, it is vital that we take into account the value of universities’ wider social contributions in that conversation.
New data made available through the cross-government Longitudinal Education Outcomes dataset allows us to look for the first time at how individual universities are contributing to social mobility. Matching robust data on socio-economic background and educational pathways to linked income data from HMRC for virtually the entire school population allows us to track the trajectories of young people from school, through university and into the workplace, and offers an unprecedented view into the dynamics of educational inequality and social mobility at play in universities.
This is explored in the paper ‘Which degrees are best for intergenerational mobility?’ published by the Institute for Fiscal Studies and the Sutton Trust, along with the Department for Education. This research looks at the role played by universities, subjects and even courses in facilitating intergenerational income mobility, for a cohort of young people currently in their thirties. The report looks at social mobility as a function of two factors:
- Access: the proportion of students from disadvantaged backgrounds getting in;
- Success: the proportion of those students going on to become top earners after graduation
Socio-economic disadvantage as defined by eligibility for Free School Meals at age 16, a robust and commonly used measure. Mobility is defined as moving into the top 20% of incomes measured at age 30 (though the research also explores the top 5% and the top 40%).
Findings
In general, disadvantaged young people who attended university were almost four times more likely to count among this high income group than those who hadn’t (22% versus 6%). While this partly reflects differences in the characteristics of the two groups, primarily their levels of school attainment, previous research has shown that, controlling for such background factors, the returns to attending university are positive, and higher for less well-off groups. Nonetheless, a ‘class pay gap’ in outcomes between graduates of different backgrounds remains, even amongst those who attend similar institutions. 40% of disadvantaged graduates from Russell Group universities become top earners, but 54% of those who were privately educated.
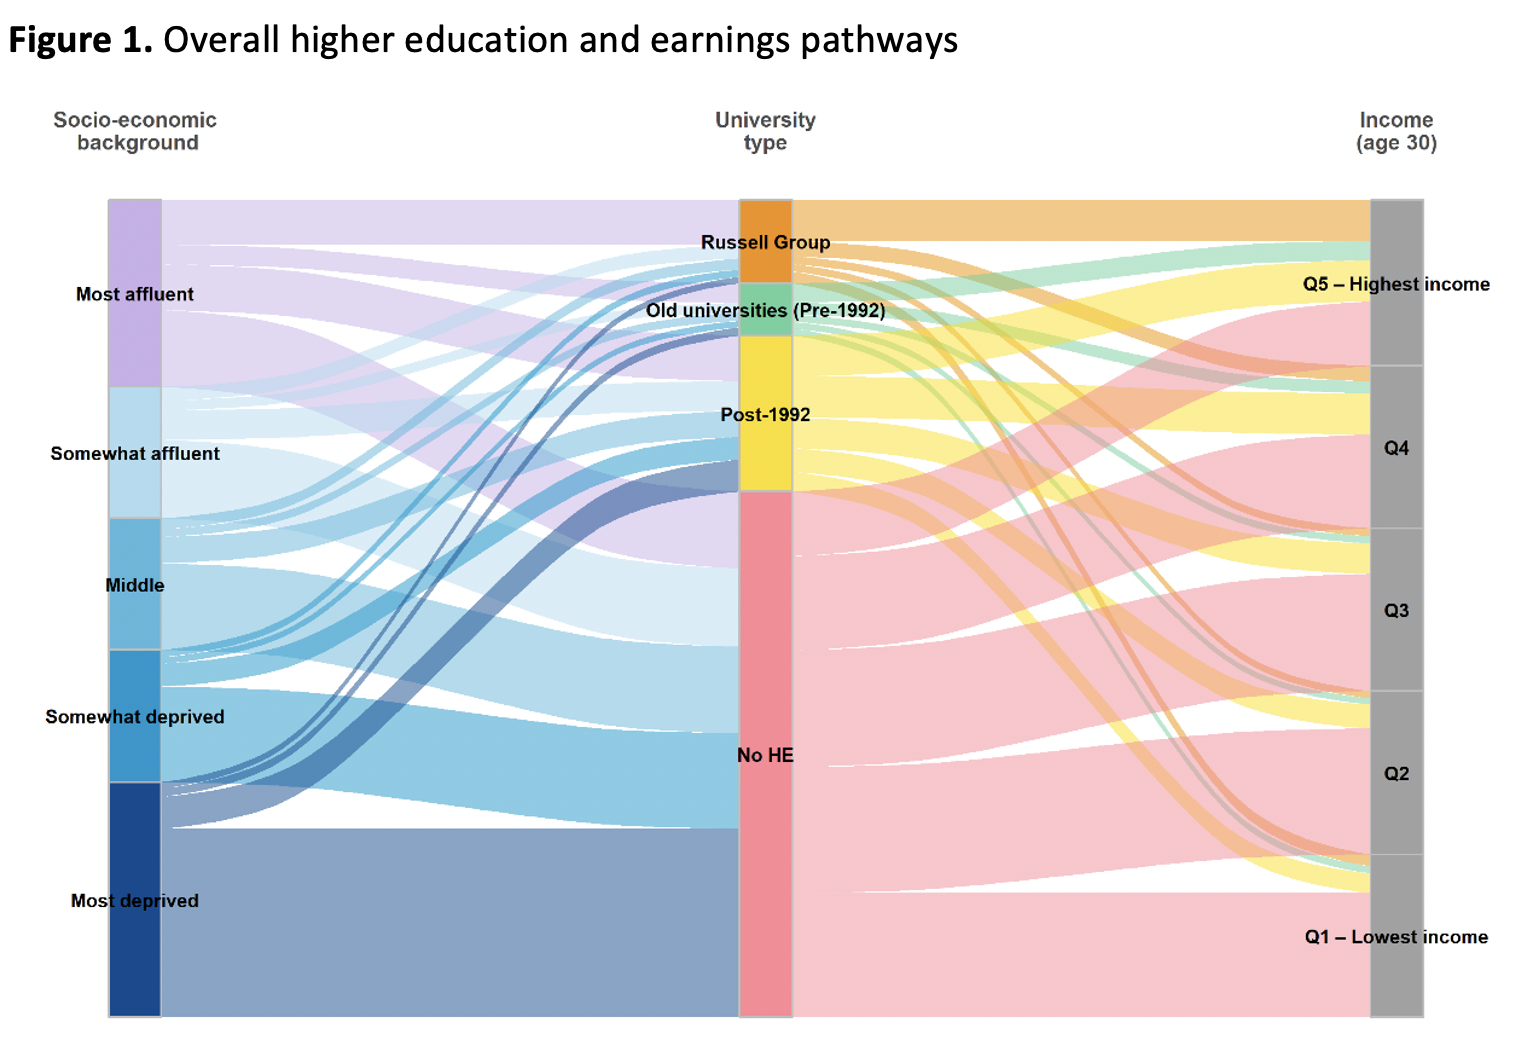
Access and success were in general inversely related across the university sector. Universities strong for access tended to have lower labour market success rates, and vice versa. The most selective universities in the Russell Group had extremely high success rates for the disadvantaged pupils that attend, but comparatively low numbers were admitted. Post-1992 institutions, however, took on much larger numbers of those from less well-off backgrounds.

As a result, despite the frequent focus on Russell Group institutions as drivers of social mobility, it is actually less prestigious universities who are contributing most strongly to social mobility as it stands, because the majority of such students attend these institutions. This role has been under-appreciated. Many of the institutions with low average labour market returns, are actually doing very well for the populations they serve. This impact is accentuated further if you control for the characteristics of their intakes, including prior attainment.
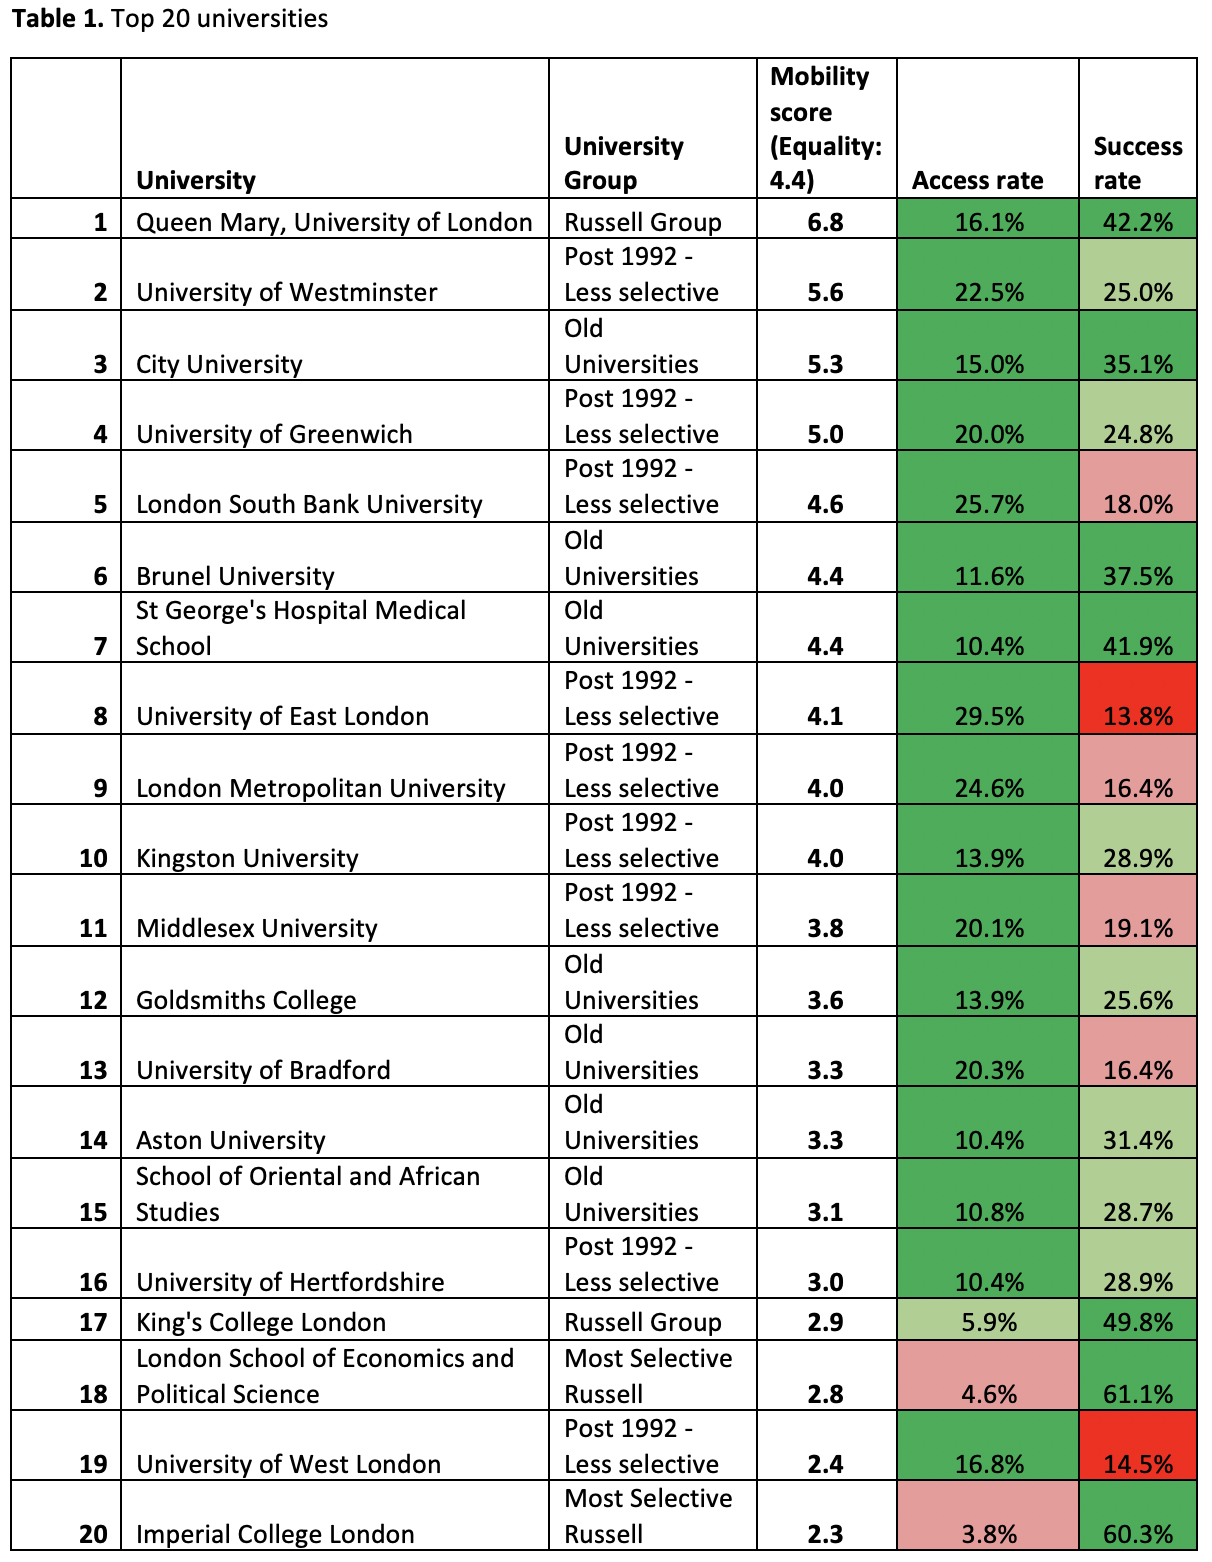
Table 1 shows the top performing universities on these measures. The list is dominated by less selective universities in and around London, and comprises a mix of institutions with high access rates and good success rates, along with some, such as King’s College and LSE, with lower access rates but exceptional success rates. Queen Mary, coming top of the list, admits a higher rate of disadvantaged students than the school population, with over 40% of them going on to become very high earners.
Capital gains
The role of London is a key point of interest. 18 of the top 20 universities are based in and around the city. The most obvious reason for this is that graduates are more likely to live in the capital, with accordingly high salaries. The report therefore calculates an adjusted mobility rate taking the location of graduates into account, based on the cost of living in an area. While the gap between London and the rest is reduced, and they are joined by universities such as Bradford, Aston and Newman, London still holds 13 of the top 20 places. So there are other factors at play also.
In particular, London has comfortably the highest FSM access rates in the country (Table 2). Explaining this in part are high levels of FSM eligible high school attainers, which mean a larger pool to draw on for universities seeking to widen participation, as well as a high proportion of such students from ethnic minority backgrounds, groups which are more likely to progress to higher education. Nonetheless, the fact that a high proportion of social mobility is happening in and around the capital should be a source of worry, particularly in the context of the government’s levelling up agenda.

Nonetheless, progress has been made over time. The overall mobility rate for the cohort who attended university in the mid 2000s was 1.3%. For context, if there was total equality, the rate would be 4.4%. Projecting ahead to the 2018 and 2019 entry cohorts, mobility is estimated to be 1.6%. A modest improvement in this time, but amid general pessimism around social mobility, an indication that widening participation efforts in recent years have not been in vain. At Russell Group universities, mobility is estimated to rise from 1% to 1.3%-1.4%.
This data provides an unprecedented insight into educational inequality and social mobility in higher education. It highlights the challenges for harnessing higher education as a driver of social mobility, but at the same time showcases what can be achieved by the sector. Any ranking is by its nature reductive, but this one allows a broadening of the conversation around the value and function of higher education. University league tables are not going to go away, despite what many would like, but a more rounded approach, accompanied by a greater focus on equity and opportunity, would ultimately be a significant step forward.
__________________
Note: for the full data see here.
Carl Cullinane is Associate Director of Research and Policy at the Sutton Trust.
Photo by Martin Adams on Unsplash.