 Using BES survey panel data, Steven Ayres investigates three important trends with implications for 2015: changing attitudes in Scotland, whether UKIP support can be sustained, and perceptions of economic well-being under a Conservative/Labour government.
Since 1964, the British Election Study (BES) has been surveying voters at each General Election in an attempt to establish who votes for who and why. The study has evolved over time, yet the central focus on political preferences and values, attitudes towards political engagement, and the socio-demographic characteristics of voters has remained.
The BES released the third wave of their 2014-17 internet panel study in late 2014, with Wave 1 taking place between February and March 2014, Wave 2 between May and June, and Wave 3 between September and October. A panel study is a type of survey that collects information on the same individuals at multiple points in time, which allows us to follow the same respondents from wave to wave, tracking the evolution of respondents’ attitudes towards election-related issues over time.
In this post, I’ll analyse three trends emerging from the latest data, each of which may play an important role in deciding the result of May’s General Election.
1. Voters in Scotland
Despite the rejection of independence by a margin of just over 10 percentage points in Scotland’s September referendum, the questions of constitutional and political change that arose in the lead-up to the vote have continued to cause reverberations across the political landscape in Scotland, the UK and across Europe. The House of Commons Library previously explored what a general election might look like without Scotland, and now that we know Scotland will stay we can use BES data to investigate how changing attitudes in Scotland over the course of the referendum campaign may affect the results in May 2015.
The first of the charts below shows how the gap between the SNP and Labour widened over the course of the referendum campaign. The share of those intending to vote for Labour at the next General Election fell by around 5% points while the SNP share rose by over 6% points. Of the new General Election voters gained by the SNP between Waves 1 and 3, 42% came from Labour and 23% were previously undecided. Using Electoral Calculus to model this in terms of seats, we find that the SNP vote share reported at Wave 1 would have secured the party 17 seats, with an increase to 42 seats based on Wave 3 vote shares. Some of the other parties made modest losses in Scotland (Liberal Democrats and Conservatives) while others made modest gains (UKIP and Greens), yet the main story is the movement from Labour to the SNP.

Given that the referendum resulted in the highest modern-day turnout at a nationwide referendum or parliamentary election in Scotland since the franchise was extended to women in 1918, some commentators have questioned its legacy in terms of political participation. The BES indicates that this unprecedented high turnout may not carry through to next year’s general election. 87.6% of respondents indicated no change in their likelihood to vote in the next general election, 7.9% said they were more likely to vote and 4.9% said they were less likely to vote. This compares with a 10.9% increase in likelihood in England and a 10.1% increase in Wales over the same period.
2. European Elections and UKIP
In a previous article I raised the question of whether UKIP support in the 2014 European Parliament (EP) elections would be sustained through to the 2015 General Election. In previous European elections where UKIP performed well, their vote share subsequently collapsed by general election time. Despite the repetition of this pattern over the last 15 years, some experts predict that in 2015 this would not be the case. Evidence emerging from the BES appears to reinforce this prediction.
The chart below uses BES data to track movements in voting intentions over the course of 2014, taking into account the sizeable boost in support for UKIP in the EP elections. The centre of the chart shows UKIP’s vote share in the EP elections as estimated by the BES. Note that due to sampling error this is slightly overstated relative to the actual vote share of 27.5% that UKIP received. The boxes to the left and right show General Election voting intentions before and after the EP elections.
As an example, the outline below tracks Conservative voters across the 3 stages:
Wave 1 (February-March 2014): 24.8% of respondents said they intended to vote for the Conservative Party in the next general election.
Wave 2 (May-June 2014): The Conservatives lost 6.8% points of their vote share to UKIP.
Wave 3 (September-October 2014): 6.2% points of the vote share that UKIP received in the EP elections has moved to the Conservatives in terms of general election voting intention.

While there does appear to have been a transient element to the UKIP vote in the EP elections, there is also a UKIP core of around 14% to 15% of the vote that may not have existed in previous years.
3. The Economy and 2015
With the economy consistently reported by voters as one of the top issues facing the country, perceptions of economic well-being under a Conservative/Labour government are often highlighted as having an important role to play in May. In YouGov polls, Labour last enjoyed a lead on handling of the economy back in February 2013, and since then they have slipped as far as 16 points behind the Conservatives on the issue.
The two parties have taken very different stances on the current state of the economy, but to what extent have these opposing narrratives pushed voters in either direction? The chart below shows how voters who have recently come into the Labour or Conservative fold (i.e. have changed from other parties/non-voters to either party between Waves 1 and 3 of the BES) feel about the national economy and their personal finances over the previous 12 months. Using new voters allows us to see how their switch to the party correlates with feelings on this core issue.
A first point to note is that feelings on the national economy do broadly tally with the voting intentions of this sample. 62% of new Conservative voters feel that the situation has improved and only 14% that it has worsened, while new Labour voters are less positive with 36% or them recognising an improvement and 34% saying that it has worsened. Interestingly, the fact that over a third of new Labour voters reported an improvement implies that either they think Labour could be doing a better job still (confounding the polls on handling of the economy) or that their voting intentions are not motivated by the economy at all (confounding the polls on the economy as a key issue).
The percentage of new voters to Labour and the Conservatives who feel like the national economy / their household finances have changed for the better / worse over the last 12 months
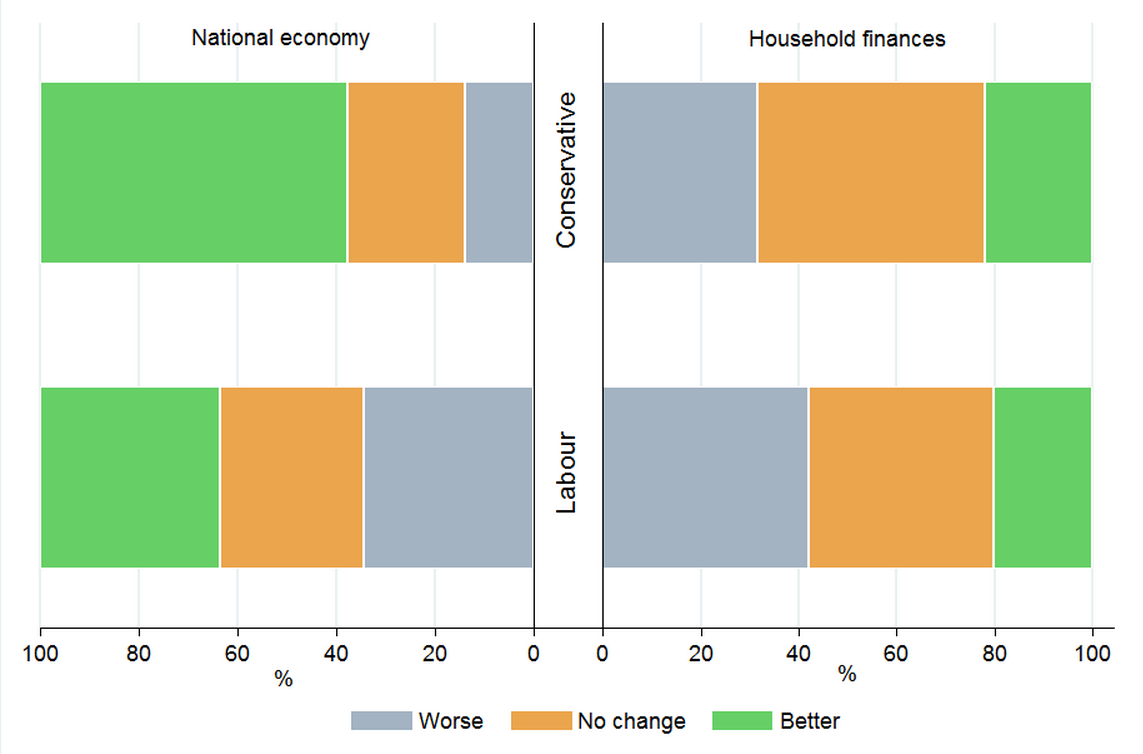
There are less positive views on household finances, with a smaller proportion reporting an improvement and a larger proportion reporting a deterioration across both parties. 42% of Labour voters reported that the situation had worsened compared with 32% of Conservatives. Interestingly, the Conservative party has attracted these new voters despite 78% of them feeling that their household finances have either worsened or not changed over the last 12 months. Again, this could imply any number of things. They might feel that the wider national recovery will trickle down to their household eventually, that there is no better party for the job, or that there are more important issues determining their voting intentions than the economy.
Note: Further analysis of trends and commentary from leading experts can be found on the British Election Study website. This article was originally published on Second Reading, the House of Commons Library blog. Please read our comments policy before posting. (Featured image credit: UK Parliament CC BY 2.0)
Steven Ayres is a former Economics and Development Consultant with the United Nations in Bangkok and now works as a Statistical Researcher for the House of Commons Library, focusing on the issues of democracy, social security and immigration.


