

 Each month, the team from electionforecast.co.uk compare new constituency polls as they are released to their estimates of what polls would show in those constituencies. This allows for an assessment of the accuracy of their modelling approach. More information about the overall model can be found here. The results presented in this post use the constituency polls released by Lord Ashcroft on 19th February 2015.
As we did for previous releases of Lord Ashcroft’s polls, in this post we compare the constituency polls released on 19 February to our estimates of what such polls would show from the previous day. This is a test of our model’s ability to accurately predict what polls should show in constituencies where there has not yet been a poll.
In February, Lord Ashcroft only polled four constituencies – all of them Conservative-UKIP battlegrounds. These are especially difficult to forecast, as there is a dearth of historical data when it comes to UKIP, due to their relatively recent ascent to the national political stage. Nevertheless, the plots below indicate that while we are not getting every detail right, our model broadly captured the current state of play in these constituencies. We plot our estimates from 18th February for these constituencies on the x-axis and the Ashcroft estimates on the y-axis. One technical point to note: our model uses the data before the application of the “spiral of silence” adjustment, so while Ashcroft’s headline numbers showed the Conservatives ahead in all the polled seats, our plots reflect the fact that in two cases this was due to the reallocation of survey respondents failing to give a preference to the parties they voted for at the last election.
Both the polls and our estimates include uncertainty; in the figures below we break these results out by constituency and plot ellipses capturing the joint margin of error around each point. Whenever these ellipses cross the dashed 45-degree line, we can say that our predicted vote share range for a given party, in a given constituency, coincides with the range implied by Lord Ashcroft’s polls.
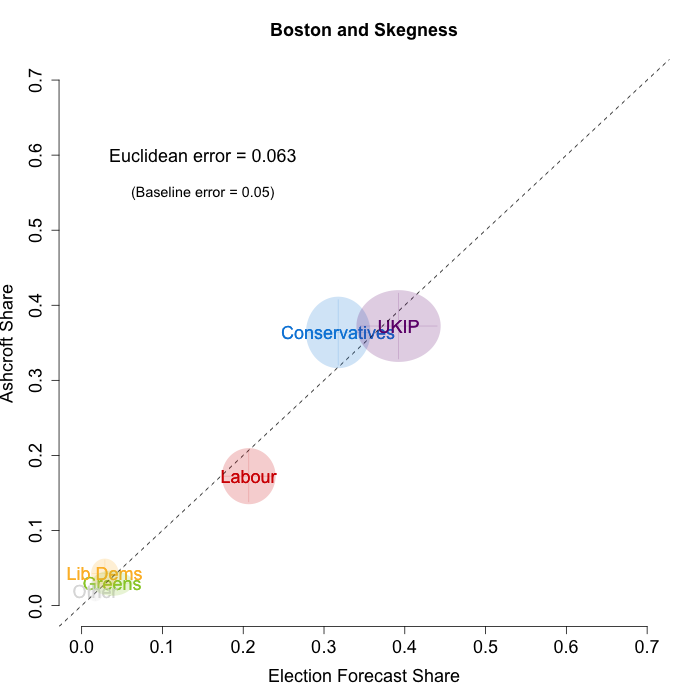
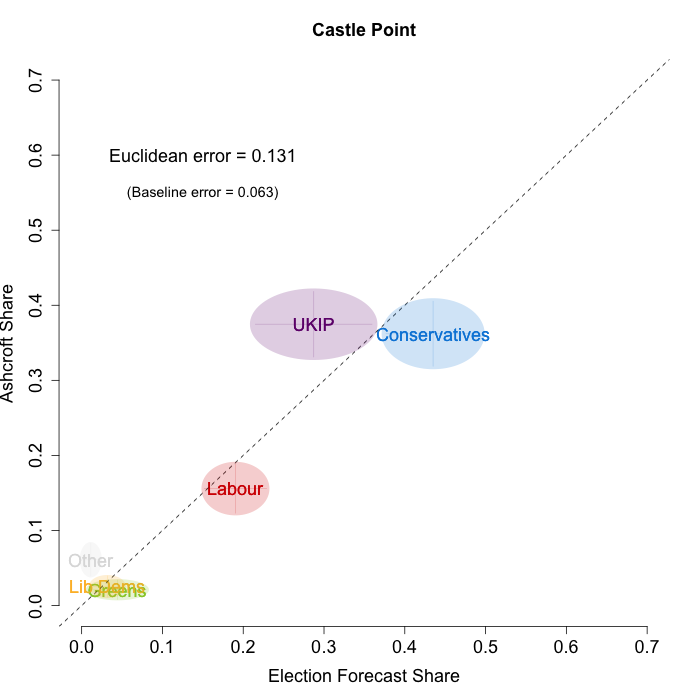
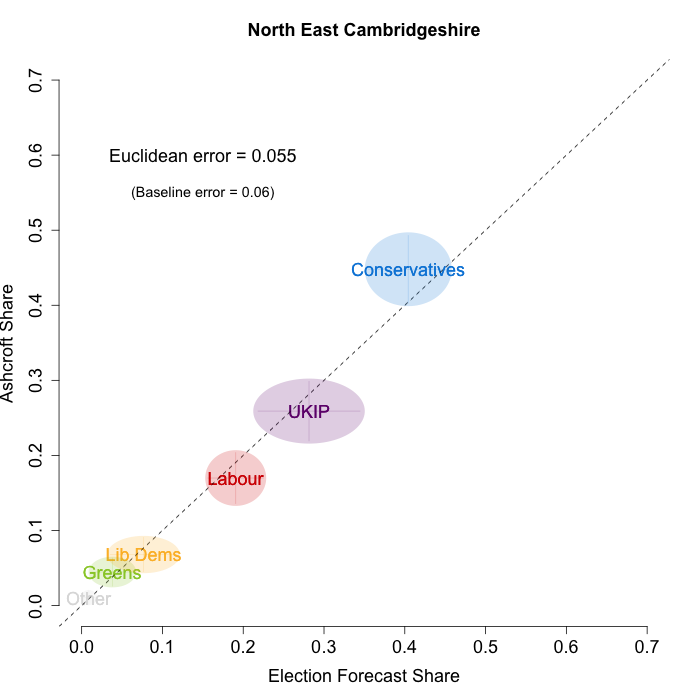
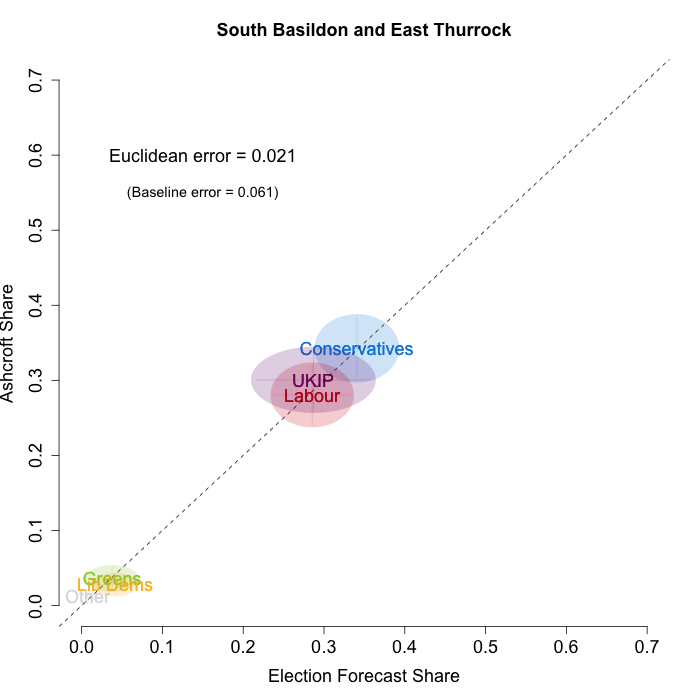
Our poorest estimates were for Castle Point, where we were predicting a relatively comfortable Conservative win, but the Ashcroft polls suggest that UKIP and the Conservatives are nearly level. In the other three constituencies our estimates were close to what Ashcroft’s polls indicate. To measure the magnitude of our prediction errors more rigorously, we compute a Euclidean distance between our estimates and Ashcroft’s polls, as we did for the Scottish constituency polls in January. Averaging across all constituencies, the mean distance between our estimates and Ashcroft’s polls 6.7 percentage points. Given the size of the polls and the uncertainty we were calculating for our estimates, we would have expected it to be 5.9 percentage points. As with the Scottish polls, we were a little overconfident in our estimates, but not much.
How does this compare to a simpler forecasting model? An alternative way of assessing our forecasts is to compare our estimates to those from a uniform swing model. As we have mentioned before, there is no single correct method for calculating uniform swing, and so we use three versions that give UNS a good chance to perform as well as our own model. First, we calculate the England-only swing from our poll estimates for all of England, calculate the average swing implied by those, and then apply that average swing to each constituency’s 2010 results. If we do this, the mean Euclidean distance is 19.1 percentage points: much larger than the 6.7 percentage points we calculated for our estimates.
However, this England-wide swing is not a very good model, because the swing across England is not uniform, particularly for UKIP. We can be kinder to the UNS model by calculating the average swing from our poll estimates using only the four constituencies that Ashcroft polled in February. We then apply that average swing to each constituency’s 2010 results, and calculate a mean Euclidean distance of 11.6 percentage points. So we are also doing much better than a uniform swing, even just applied among the polled constituencies. Finally, even if we calculate the average swing across the Ashcroft constituency polling itself, and use that to apply a uniform swing, our model still comes out on top: the error for the Ashcroft-only swing is 10.7 percentage points. The swings in these four constituencies are far from uniform, so even knowing exactly the average swing and applying that swing uniformly across the polled constituencies, you would be far less successful at predicting the constituency-level than by taking our estimates from before the polls were released.
Although there are only four constituencies in this month’s Ashcroft polls, the constituencies selected are challenging for any forecasting model. Overall, it is encouraging that our model continues to perform well in these tests, and gives us additional confidence looking forward to the election. Of course, in the 76 days remaining until the general election, there is still plenty of time for things to change. As ever, we aim to capture this uncertainty in our model, and will continue to update our forecasts as new data arrives in the coming weeks.
Jack Blumenau is a PhD candidate in Government at the London School of Economics.
Chris Hanretty is a Reader in Politics at the University of East Anglia.
Benjamin Lauderdale is an Associate Professor in Methodology at the London School of Economics.
Nick Vivyan is a Lecturer in Quantitative Social Research at the Durham University.