 While prominent immediately after Labour’s performance in the 2017 election, the idea of a ‘youthquake’ has since been challenged by the British Election Study team. Using the latest data from the Understanding Society survey, however, Patrick Sturgis and Will Jennings show that there was, after all, a large and significant increase in turnout amongst the under 30s.
The 2017 snap general election saw a substantial reconfiguration of party support during the short campaign from 18 April to Election Day on 8 June. From polling as low as 25% in mid-April, Labour surged to as high as 40% in the final polls, an estimate that matched their actual vote share. While not historically unprecedented, such large shifts in voting preferences are rare during the course of a campaign.
Commentators have offered a variety of explanations for the surge in Labour support in 2017. These include disaffected Conservative Remainers switching to Labour, weaknesses in the Conservative manifesto and campaign strategy – in particular the so-called ‘Dementia Tax’ and widespread tactical voting for Labour as a means of preventing the Conservatives from winning a landslide. In the weeks after the election, however, the most widely held view was that Jeremy Corbyn had particularly appealed to young people, who turned out to vote at historically unprecedented levels – the so-called ‘Youthquake’.
The Youthquake theory was supported by an analysis of constituency level vote shares carried out shortly after the election by Oliver Heath and Matthew Goodwin, which found the largest increases in turnout were in constituencies with larger numbers of young people. Pre- and post-election polls conducted by The Stream for the music magazine NME and by Ipsos MORI also showed large increases in turnout amongst 18- to 30-year-olds between the 2015 and 2017 elections. YouGov’s own polling, as well as polls it carried out for the Essex Continuous Monitoring Survey, provided further corroborating evidence of a large increase in voting amongst those aged under thirty. As this all tallied with anecdotal evidence, such as Corbyn’s ecstatic reception at Glastonbury, the idea that Labour’s electoral gains were driven by young voters soon became established as conventional wisdom.
The British Election Study (BES) team, however, were not convinced. In a widely reported study, they showed that there was no relationship between the proportion of 18- to 30-year-olds in a constituency and the level of turnout increase once population density was controlled for. Turnout just happened to have increased most in constituencies with more young people, and it could not be concluded from this aggregate evidence that more young people actually turned out to vote. They also noted serious limitations of opinion polls for studying voting behaviour, namely that polls substantially over-estimate turnout. This is for two reasons. First, UK polls employ non-random sampling procedures which include too many politically engaged people and too few non-voters. Second, a substantial minority of people tell pollsters that they voted when they in fact didn’t.
The BES team undertook their own individual-level analysis of turnout amongst young people using the 2015 and 2017 waves of the BES. The BES is a post-election cross-sectional survey that has been fielded at every election since 1964. It adheres to the highest methodological standards, using face-to-face interviews and strict random sampling at all stages. The survey also includes a vote validation component, in which respondents’ self-reported vote is validated against electoral records. This means that estimates of turnout are not biased by misreporting.
Using these higher quality data sets, they found little in the way of change in turnout for the under 30s in 2017, concluding, “there is no evidence to suggest the relationship between age and turnout changed substantially between 2015 and 2017”. The same conclusion was drawn by John Curtice and Ian Simpson in their analysis of the 2015 and 2017 British Social Attitudes (BSA) surveys, which also employ random sampling and face-to-face interviews. While the BSA showed a 6 percentage point increase in turnout for the 18 to 24 group, this was not statistically distinguishable from no change.
So, case closed? Perhaps not. In November 2018, the University of Essex released Wave 8 of the Understanding Society survey. Understanding Society is a longitudinal household panel survey which interviews a random sample of the UK population annually on a range of different topics, including voting and party support. Like the BES, Understanding Society uses ‘gold standard’ methods. A key feature is its very large sample size (around 40,000 respondents at Wave 8). This is important for our purposes here, because the primary limitation of both the BES and the BSA is their comparatively small sample sizes for sub-group analysis. For the BES, the sample size for 18- to 24-year-olds in 2017 was just 109 using validated vote and 151 using self-reported vote, while for the BSA (which only has a self-report question) the sample size was just 162. These small samples make it difficult to statistically detect even quite large changes in turnout between elections (particularly when weights are applied, as this tends to reduce the effective sample size still further).
In Waves 2, 7, and 8 of Understanding Society respondents were asked whether they had voted in the most recent election and, if they had, which party they voted for (corresponding to the 2010, 2015 and 2017 general elections, respectively). The number of 18 to 24 year olds was 1,897 in Wave 2, 1,363 in Wave 7, and 919 in Wave 8. (These are the sample sizes for respondents who were asked the turnout question and provided a valid answer. The full sample sizes for this age group are larger. The sample size is lower in Wave 8 partly due to attrition and partly because some respondents were interviewed before the election, so were not asked whether they voted.) These larger sample sizes make it possible to assess the evidence for change in turnout among young people at a higher degree of granularity than has been possible to date.
Figure 1 plots non-parametric regression estimates of the relationship between age and turnout. The dark blue line, which represents turnout in 2017, is clearly and substantially higher for the youngest voters, aligning with 2015 turnout at around the age of 35. Interestingly, the figure also reveals a significant increase in turnout for the youngest voters between 2010 and 2015, a change which has not, to our knowledge, been previously noted – indeed the focus of Ed Miliband’s Labour on youth engagement in the run-up to the 2015 general election was widely derided at the time.
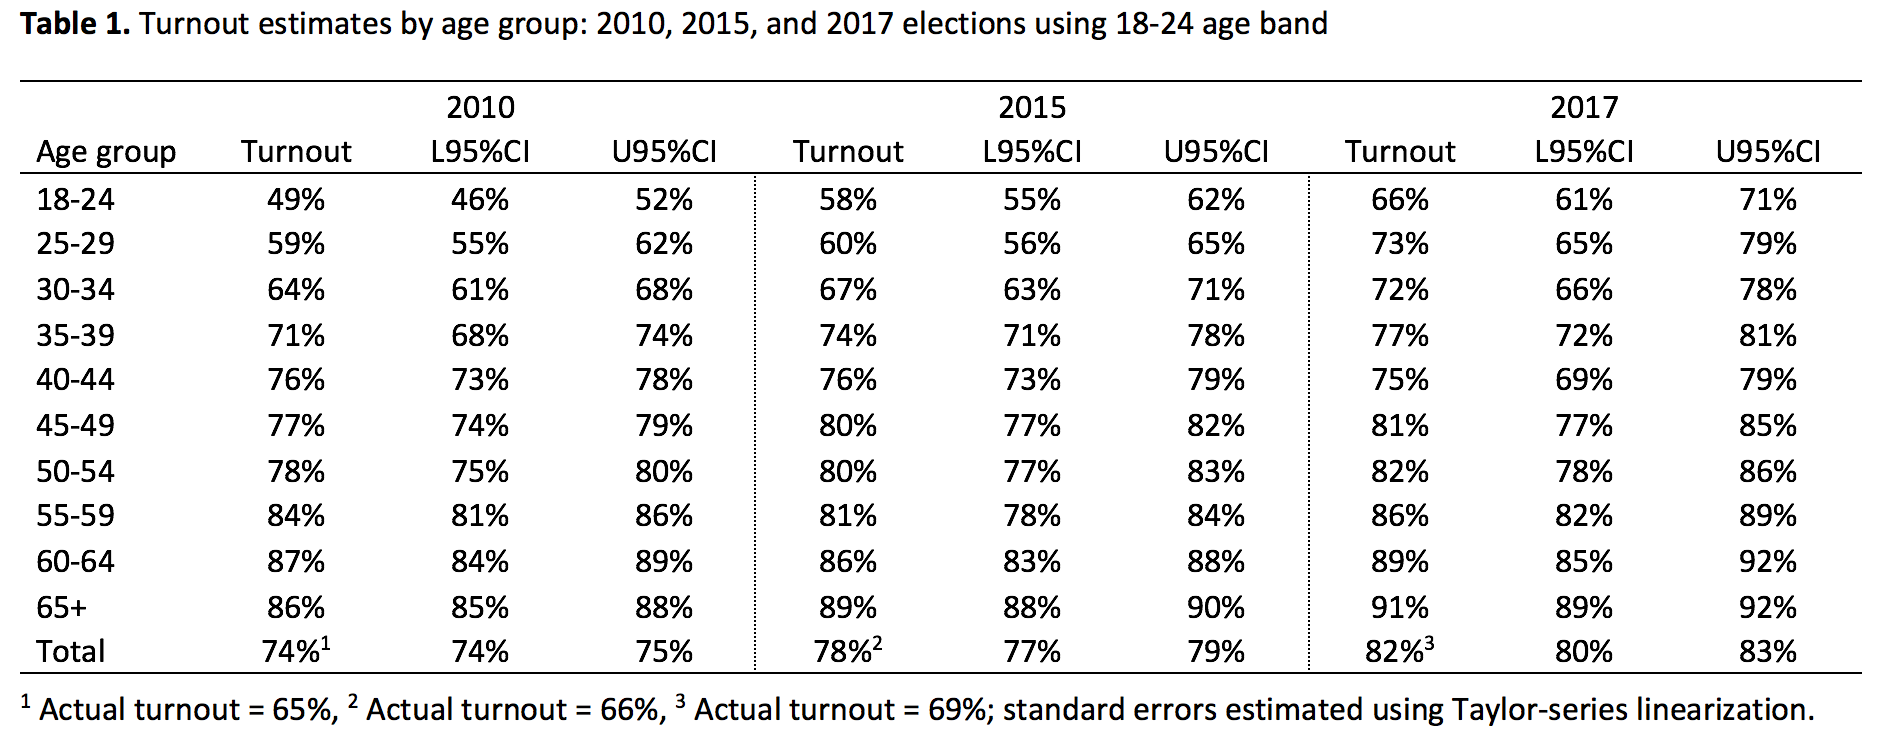
The estimates in Figure 1 are unweighted, so do not account for the greater tendency of non-voters to drop out of the Understanding Society panel over time. We therefore also compare turnout proportions within age-bands using a weighted estimator. The results are reported in Table 1. These show that there was an 8 percentage point increase in turnout for 18-24 year olds between 2015 and 2017, although this difference is marginally non-significant at the 95% level of confidence. For 25- to 29-year-olds, the increase in turnout is 13 percentage points and this difference is statistically significant. Differences in turnout at higher age bands are smaller and none are statistically significant.
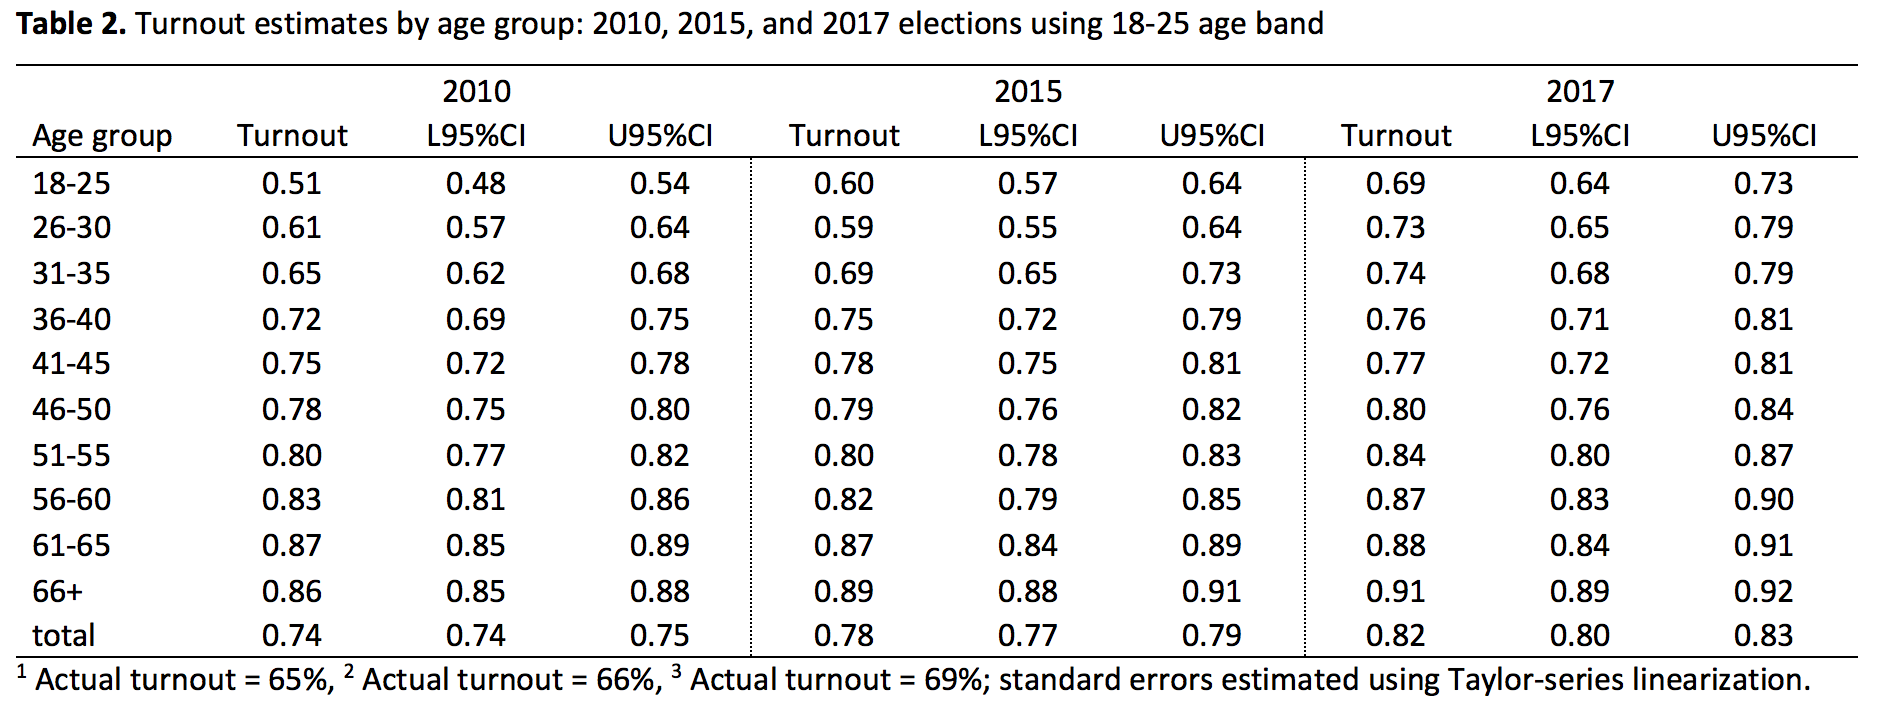
The thresholds used for age bands are essentially arbitrary (i.e. why use 24 years as the cut-off point for the youngest group?). We therefore also present estimates in Table 2 using 18-25 for the youngest group with age bands increasing at five-year intervals thereafter. Using this age banding, the increase in turnout is statistically significant for both the 18-25 group (9 percentage points) and 26- to 30-year-old group (14 percentage points). While the statistical significance of the increase does, then, depend to some extent on how the age bands are defined, these estimates nevertheless support the claim that there was a large increase in turnout amongst voters under the age of 30 in the 2017 general election.
Figure 1. Nonparametric smoothed local polynomial regression probability of turnout by age in years, Understanding Society Waves 2, 7 & 8.
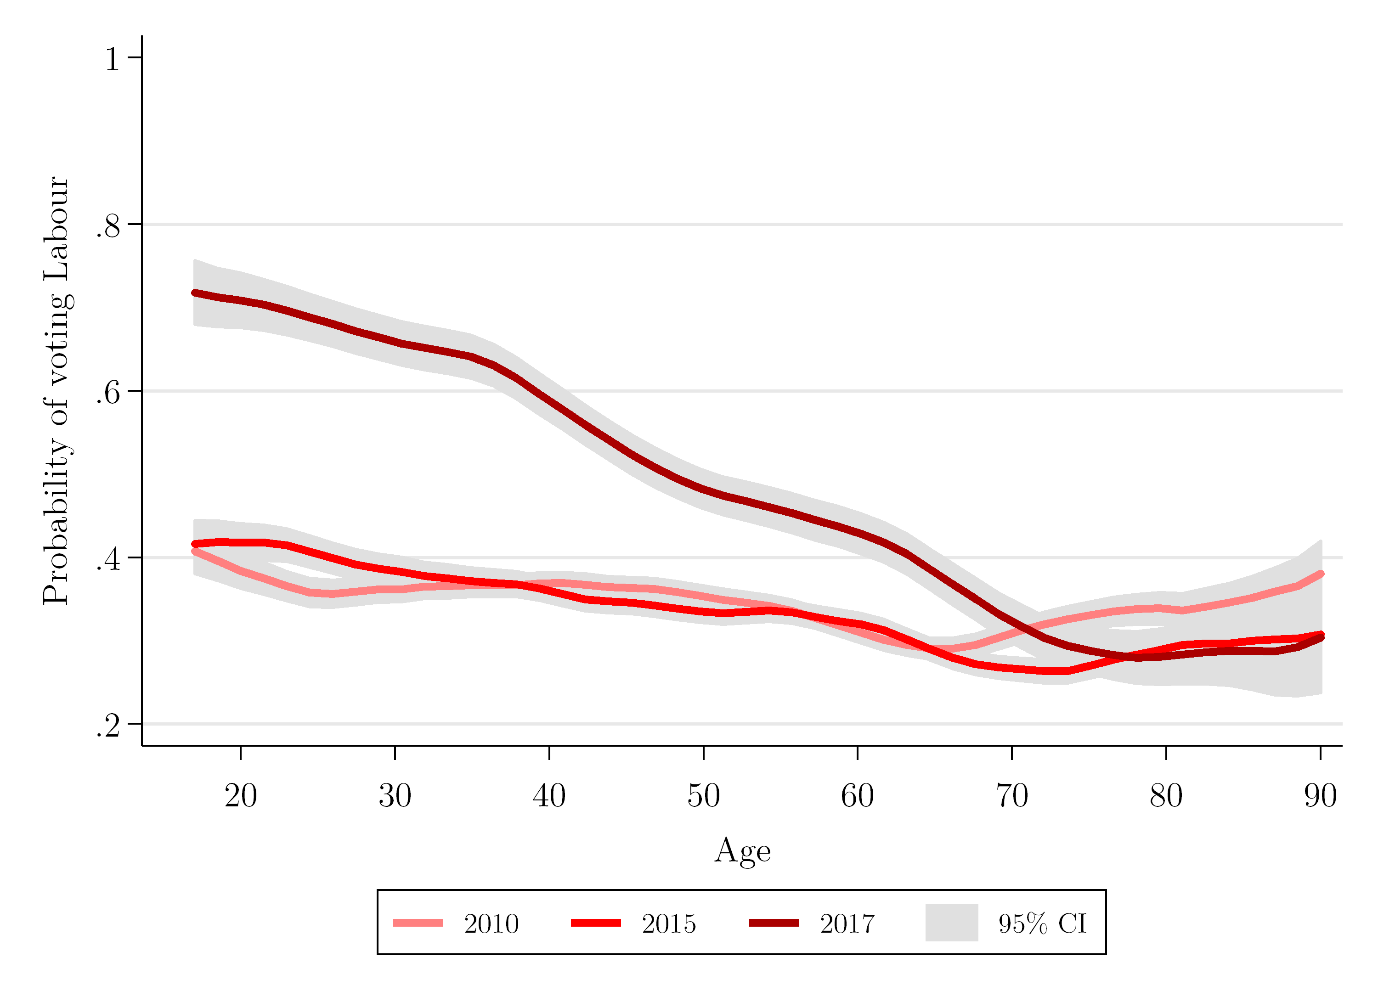
 This increase in turnout amongst young people, combined with the greater tendency of young people to vote Labour in 2017, means that the party drew particularly heavily on the support of younger voters in this election. This can be seen in Figure 2, which plots predicted probabilities of voting Labour by age. Strikingly, the probability of someone in their 20s voting Labour is estimated at around 0.7 compared to 0.4 in 2015 and 2010.
Figure 2. Nonparametric smoothed local polynomial regression probability of Labour vote by age in years, Understanding Society Waves 2, 7 & 8.
Like the other sources of data discussed here[1], the Understanding Society survey has its own limitations and weaknesses, most notably a low response rate – although the wealth of information on nonrespondents available from earlier waves means that powerful weights are available to correct for differential nonresponse – and the use of self-reported turnout (rather than validated vote). It over-estimates turnout at each of the past three general elections by between nine and 13 percentage points, no doubt a combination of nonresponse bias and mis-reporting. Nevertheless, it is not unreasonable to assume that these biases are largely stable across waves, i.e. the levels of estimated turnout may be too high but there is little reason to assume that changes in turnout or party support should be subject to systematically different biases across elections. And, while the size of the turnout increase we see in this data may not be as of great a magnitude as some have contended, it would seem that 2017 may have witnessed something of a Youthquake after all.
[1] Interested readers are directed to Roger Mortimore’s excellent chapter on data sources for measuring turnout in the UK in the forthcoming book Political Communication in Britain.
_________________
Patrick Sturgis is Professor of Research Methodology in the Department of Social Statistics & Demography at the University of Southampton and Director of the ESRC National Centre for Research Methods.
Will Jennings is Professor of Political Science and Public Policy at the University of Southampton.
All articles posted on this blog give the views of the author(s), and not the position of LSE British Politics and Policy, nor of the London School of Economics and Political Science.


Ian Brinkley
My hypothesis would be that ‘young people’ were politicised by the policies of the Coalition govt which disproportionately affected the young from the start in 2010. This was evidenced by London riots of 2011 and the development of horizontalist groups like Occupy and Uncut. Gradually, there was a realisation that opposition needed to be organised and involved with the electoral cycle. The Labour Party had already begun to attract more of the young and the return disaffected former Labour with the election of Ed Miliband but the flood gates were really opened with the election of Jeremy Corbyn. The ‘Wave’ pre-dated Corbyn but was properly crystallised by his becoming leader of the LP. For all the talk of slavish devotion to the individual, it was, in my opinion, the imperative for political change which was most significant to a generation burdened with debt, profound housing difficulties and a lack of job prospects.
A reasonable theory, though I would give less weight to marginal activist groups and more to specific policies and more general perceptions that the young are losing out. Labour’s more radical policies were attractive to younger age groups and that in turn allowed some tactical victories, such as Canterbury. But this also created an unresolved challenge of how to appeal to older and more cautious voters and socially conservative working class voters. Solving that is key to Labour’s future success in the next General election. The youth vote is not big enough to be decisive, even if Labour is able to sustain that support through to 2022.
If true, then one reason might be that many young people mistakenly thought that Corbyn and Labour were for Remain.
This November 2017 HEPI survey of students found that over half of Labour-voting students thought that both Corbyn and Labour were for Remain.
https://www.hepi.ac.uk/2017/12/18/two-thirds-68-students-now-back-labour-think-labour-55-jeremy-corbyn-58-back-remain/
It is surely harder for them to hold that view now, with Jeremy Corbyn consistently propounding his Brexit proposal.
So the Youthquake may go elsewhere in the general election if Labour stick to present policy.
Very interesting. If I have read the two tables correctly the turnout for young people increased both pre and post Corbyn (2010 to 2015 and 2015 to 2017) and by about the same amount in percentage points. It was the greater share who then voted Labour in 2017 which was new. It would be good to have some insight on why turnout was moving up after 2010 and what difference to Labour’s share of the vote the greater tendency to vote Labour among the young made. Also, do we have any comparable findings on the 2016 Referendum?
Ian: try this link for breakdowns of voting patterns in the 2016 Referendum
https://lordashcroftpolls.com/2016/06/how-the-united-kingdom-voted-and-why/