Posted by Patrick Dunleavy and Chris Gilson
In our most recent polling measures, the ‘Other’ category has recently been polling at 14 per cent across a range of polls, and often higher. The combined support for UKIP, the Greens, the BNP and the Nationalists in Scotland and Wales has rarely fallen below 12 per cent in any recent polls.
This is a historically high level – this time five years ago, the same category was polling at around 8-9 per cent. And two months prior to the 2001 election the ‘Other’ parties were polling just 5 per cent. In other words, support for these 4th, 5th and smaller parties has more than tripled in less than a decade.
Why might there be such a great difference this year? How has the UK political landscape been changing over the past 5-10 years for the smaller parties? The following slide from Patrick Dunleavy’s presentation at the British Election Conference last weekend, we can see that there is far more to the UK’s ‘election landscape’ than Labour and the Conservatives.
The Tories used to be able to rely on ‘no enemies on the right’, but now UKIP and the BNP are an increasingly potent menace who could cost David Cameron vital percentages of support in a close-fought race. With Tory grandee Norman Tebbit urging Conservative voters to back Nigel Farage of UKIP against Speaker John Bercow in his constituency, this is a populist story that could run better than ever before – feeding on voters’ unease over EU immigrants, and wider concerns over Tory MP’s duckhouses on expenses and Lord Ashcroft’s tax affairs.
Meanwhile Labour and the Liberal Democrats face a Green challenge that could damage them in the same way, losing them vital marginal voters in close fought seats. In Scotland the SNP is clearly on Labour’s left, although it has lost ground in recent polls and Labour’s problems there seem to be easing.
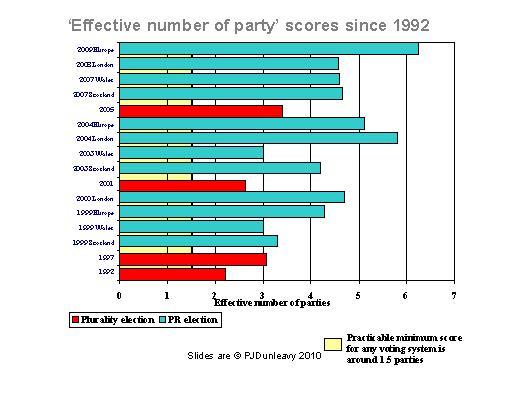
The strong showing of all these smaller parties is remarkable because all but the Nationalists are certain to do badly in terms of winning seats the First Past the Post voting system. Historically voters have been reluctant to ‘waste their votes’ in general elections on parties that will not win seats, and therefore will have zero representation in the House of Commons. This is made very clear with our measure of the ‘effective number of parties’:
The red bars shown above are for UK General Elections, where the effective number of parties has been between 2.5 and 3.25 in recent years. Yet the other green bars show that in other important UK elections – for the European Parliament, Scottish parliament and London and Welsh Assemblies – the number of parties is far greater.
The difference here is that all the green bar elections use proportional representation systems – so that more candidates are elected from a greater number of parties, as British voters clearly recognize now. Our next Table below shows that the parties beyond the ‘Big Three’ have often done very well under PR, and especially in recent years have often depressed the combined Labour/Conservative share of the vote below 50 per cent (which has happened six times in the last 7 years).
The most recent nationwide poll, the 2009 European election, was particularly striking – with UKIP racking up more voters than either the Liberal Democrats or Labour. In the 2005 General Election UKIP fielded 475 candidates, the BNP 117, and the Green Party 182. This year they will undoubtedly try to contest more seats to take advantage of their strong showing in the 2009 European elections.
UK Election Results 2003-2009
| Election | Type of Election | Total 'Other Parties' per cent | Total Labour and Conservatives per cent |
|---|---|---|---|
| 2009 Europe | PR | 43 | 43 |
| 2008 London Mayoral | SV | 12 | 79 |
| 2008 London Assembly | AMS | 28 | 61 |
| 2007 Wales Regional | AMS | 37 | 51 |
| 2007 Scotland Regional | AMS | 46 | 43 |
| 2005 General | FPP | 10 | 68 |
| 2004 Europe | PR | 39 | 46 |
| 2004 London Mayoral | SV | 21 | 64 |
| 2004 London Assembly | AMS | 31 | 52 |
| 2003 Wales Regional | AMS | 32 | 56 |
| 2003 Scotland Regional | AMS | 43 | 45 |
Note: In case you are wondering why the Other vote and Tory + Labour vote shares here don’t add up to 100%, remember that the UK’s 3rd party, the Liberal Democrats, are not shown above: their big level of support makes up the difference.
Much to their frustration, the leaders of UKIP, the Greens and BNP will not be participating in television debates, nor even receiving a great deal of media coverage. But they have one asset. They are on the ballot paper – meaning that millions of voters who have supported them as recently as 2009 will suddenly be reminded on polling day itself that they have a choice. And they are starting this general election from a higher base than ever before, and with voter dissatisfaction with the MPs from the Big 3 at an all-time high as well.
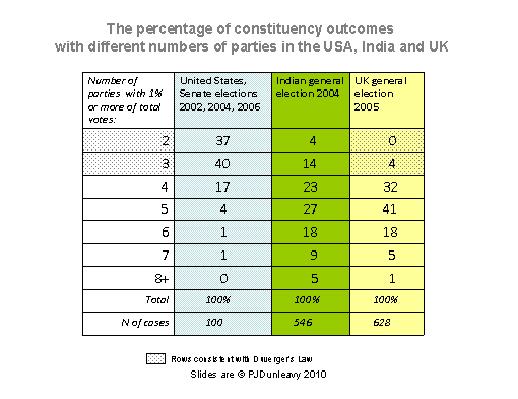
Finally, many people in Westminster and the national press still essentially think of the UK as essentially a two party state. In fact, as Professor Patrick Dunleavy has argued strongly since 2001, the UK is more like a five party system in terms of how people vote. The table below shows that while 77 per cent of US election contests have only 2 or 3 candidates, in the UK only one contest in 25 is still restricted to 3 candidates – 95% of UK contests have 4 or more candidates. In fact the average UK constituency in 2005 had five candidates – the same number as India in 2004. But India has a parliament with more than 45 clear parties n it, and a governing coalition of 18 parties – so they are well down the road to a fragmented multi-party system.


The Greens
I agree with Owen that the Greens have done very well in recent years by focusing on key areas where they have won council seats, and then expanding from that base. In fact these are exactly, the same ‘grassroots presence’ tactics that helped the LIberal Democrats to consolidate their hold in key areas and to start performing better in their key regions at general elections, as in the South West.
So it will indeed be very interesting to see how the Greens fare in the three target seats that Owen mentions. I expect that they will not in fact win a seat this time around, but that their vote shares will greatly increase and put them in a better position to possibly win these seats next time.
It is important to remember that back in 1989 the Greens actually polled 15 per cent in the European Parliament elections held before PR (but won no seats under first-past-the post). This score proved to be a flash-in-the-pan that they have never yet managed to recapture. But their current position is much more solid and committed, reflecting the Greens’ creation of a local network and support base allied with their more consistent ability to push up their national vote shares – e.g. back to 8.5 per cent in the 2009 European election.
Excellent blog – very interesting reading.
Whilst I’m sure you’re right about the increased use of PR having a beneficial effect upon the ‘brand recognition’ of smaller parties, I think of equal importance has been their respective successes at a local authority level. To take the Green Party as an example, their target seats for the GE (Brighton Pavillion, Norwich South, Lewisham) are those where the Party has done the leg-work garnering local support and council/GLA seats. The same is true of the BNP and, to a lesser extent (perhaps due to their European focus) UKIP. Bearing in mind that the parties in question are all relatively young (and haven’t enjoyed the instant Parliamentary presence afforded to the Lib Dems at their birth), I really think it has been the door-knocking and envelope-stuffing of active local volunteers that has had the greatest effect on bringing them to political maturity.
If we do see some of these parties making breakthroughs at the election, it will be interesting to see if there is a tangible change in attitude towards the ‘Others’ in the media/electorate.