 Stuart Wilks-Heeg looks at the role of marginal seats in this election. The related paper ‘A tale of two electorates: why some voters are more equal than others’ is also available from Democratic Audit.
As the election campaign entered its last week, media reporting shifted to focus on the marginals – apparently in response to the three main party leaders engaging in a whirlwind tour of these key seats. In actual fact, the party leaders have done little else than visit marginals over the past few weeks. All three have visited dozens of places on the campaign trail – almost every one of them a key marginal, or a cluster of key marginals.
As the leaders have toured the marginals, any encounters with voters have usually been pre-arranged, although once or twice events departed from the planned script. But the actual purpose of the visits is, of course, to let key ‘floating’ voters know, via media proxy, that the party leader has visited, and endorses their ‘excellent local candidate’. Duly documented by a mass of press photographers, radio and television crews, the regional and local media transmit the news to the electorate – a party leader had been in town. How else would they ever know?
Under our current electoral system, this targeting of voters in key marginals constitutes entirely rational behaviour for political parties. But what are the implications for the electorate? As political parties adopt an increasingly strategic focus on a tiny sub-section of the electorate, large parts of the country have become almost ‘campaign free’ zones. An overseas visitor arriving in many parts of the country would have real difficulty believing that there is an election going on. If it wasn’t happening on the TV, many voters in safe seats might have the same doubts.
A small scale Democratic Audit internet survey of 200 voters across a geographical spread of over 150 constituencies in Great Britain conducted mid-campaign (20 to 22 April 2010) reinforces this view. While the data should clearly be seen as little more than indicative, particularly in view of the small sample size, the table below reveals an obvious, and plausible, pattern. Voters in three-way marginals and Liberal Democrat target seats receive up to 4.5 times more contact from political parties than voters in safe Labour or Conservative seats.
Reported contact from the political parties during the first two weeks of the 2010 General Election campaign, and in the three months before the election campaign, by type of seat/contest
| Type of seat/contest | No. respondents | Average contacts (campaign) | Average contacts (pre-campaign) |
|---|---|---|---|
| LD-held marginals or LD top 50 target | 14 | 10.4 | 6.4 |
| Three-way marginals | 14 | 10.4 | 5.8 |
| Safe Lib Dem | 4 | 7.3 | 4.5 |
| Conservative targets (1-200) | 33 | 6.9 | 2.8 |
| Safe Labour | 66 | 4.5 | 2.6 |
| Conservative held-marginal | 8 | 3.6 | 3.8 |
| Safe Conservative | 48 | 2.4 | 0.9 |
Patterns of local candidate spending at the 2005 General Election tell the same story. In 2005, candidates contesting the ultra-safe seat of Barnsley East and Mexborough spent the equivalent of 8p per elector, between them, trying to win over the voters. At the other end of the scale, the combined expenditure of candidates contesting Falmouth and Camborne, a three-way marginal in Cornwall, amounted to 65p per elector.
If parties behave rationally in targeting certain seats, then the response of electors is arguably just as rational. Since casting a ballot in an ultra-safe seat is highly unlikely to impact on the outcome of the contest, voters have little motivation to turn out to vote – particularly if the parties have ignored them for the entire campaign. In an ultra-marginal, where a single ballot could realistically make the different between one candidate losing and another winning, the calculus is quite different.
Turnout rises significantly as seats become more marginal, with low turnouts concentrated overwhelmingly among the ultra safe seats. As the figure below shows, following the 2001 General Election, 324 seats were classified as ultra-safe. At the 2005 election, the average turnout in these seats was 57.4 per cent and just 2.2 per cent of the seats changed hands. Both turnout and the proportion of seats changing hands rose as seats became more marginal. Compared to ultra-safe seats, over 20 times as many ultra-marginals changed hands, while turnout was almost 10 percentage points higher.
Figure 1: Turnout and proportion of seats changing hands at the 2005 General Election, by marginality of seat (marginality based on 2001 results)
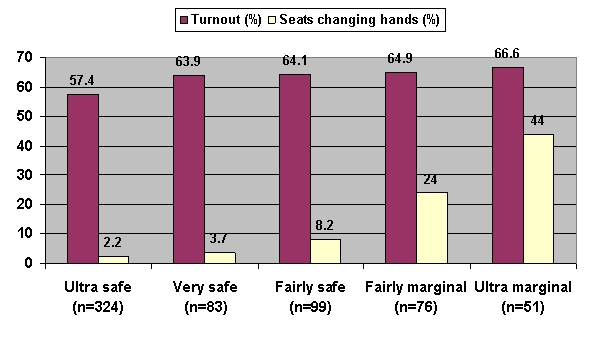
Source: Data derived from Pippa Norris’ British Parliamentary Constituency Database 1992-2005, release 1.3: http://www.hks.harvard.edu/fs/pnorris/Data/Data.htm
The main two political parties have been reluctant to debate the impact of the electoral system on turnouts, or to discuss the wider democratic implications of parties targeting their efforts at a minority of seats. But this is not simply a question of political participation. Most of the seats in which voter turnout will be lowest this Thursday also suffer from the highest levels of social deprivation. That political inequality and socio-economic inequality have become so closely interwoven is yet another damning indictment of our electoral system.


