Nicolas Hérault and Justin van de Ven present the first quantitative evaluations of tax and transfer treatment enjoyed by families with children and age pensioners, relative to the wider population. They find that households with at least one member above state pension age have benefitted substantially from the maturation of the state pension system, and that families with children and low incomes have also enjoyed substantial improvements in treatment, reflecting targeted reforms to welfare policy.
Income inequality in OECD countries has increased considerably since the 1970s, motivating research interest in the role played by reforms to the tax and benefit system. In the United Kingdom, reforms to welfare payments have been credited with off-setting rising private (pre-tax and benefit) income inequality, especially since the 1990s, by targeting welfare benefits in favour of families with children and the elderly. Yet this begs the question: to what extent have selected population subgroups benefited from reforms to the tax and benefit system? That question has been difficult to answer until recently, due to the complexity and opacity of modern transfer systems.
Our research uses a new method to visualise important shifts in the relative tax-benefit treatment of selected population subgroups during the last half-century. We focus on ‘tax implicit scales’, which measure the tax-benefit treatment of any given family type (e.g. single parents with one child) relative to a reference type (e.g. single working aged adults without children). A higher tax implicit scale indicates more favourable treatment of the family type by the tax-benefit system, relative to the reference type.
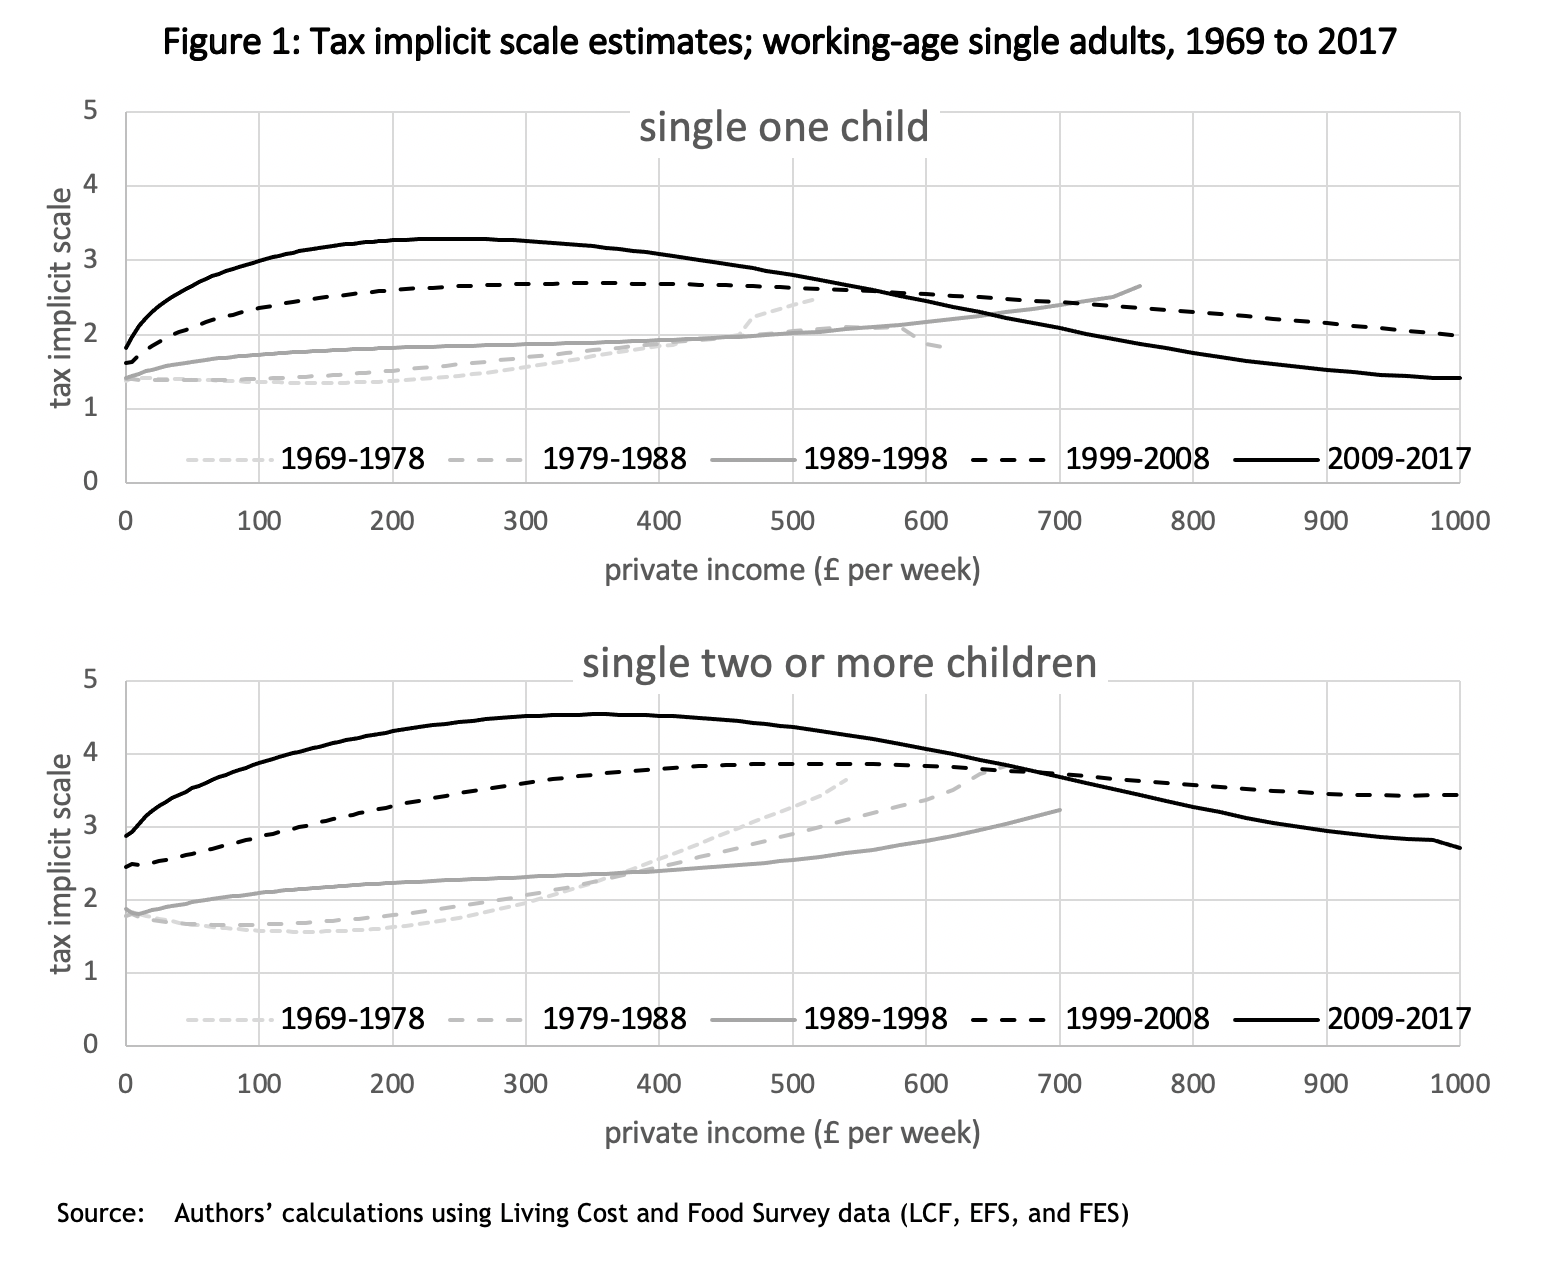
Key results from our analysis are displayed for single parents in Figure 1, for working-aged couples in Figure 2, and for pensioners in Figure 3. The tax implicit scale reported in all three figures adopt single working-aged adults without children as the reference.
 Notes: Tax implicit scales measured relative to single adult households, comprised of one adult, aged 25-59, with disposable income worth at least £55 per week, not in receipt of disability or own-business income, and without children. Single parents: same as single adult, but at least one child aged 13 or under. All financial statistics adjusted to 2018 prices by the National Accounts final consumption expenditure deflator, Office for National Statistics code YBGA. Each series reports arithmetic averages of year specific tax implicit scales over the respective decade, where the scales for each year were evaluated on data pooled over three consecutive years.
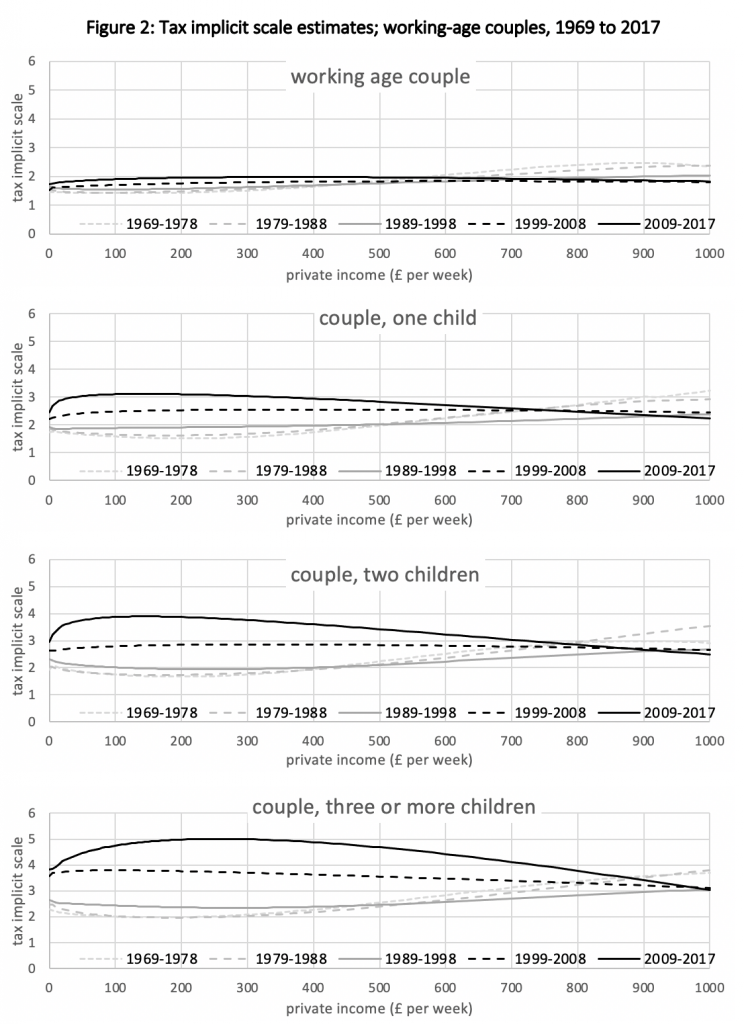 Notes: As for Figure 1. Working age couple: same as single adult, but with a second adult aged under 60 and over 13. Couple, one/two child(ren): same as couple, but with one/two child(ren) aged 13 or under. Source: Authors’ calculations using Living Cost and Food Survey data (LCF, EFS, and FES).
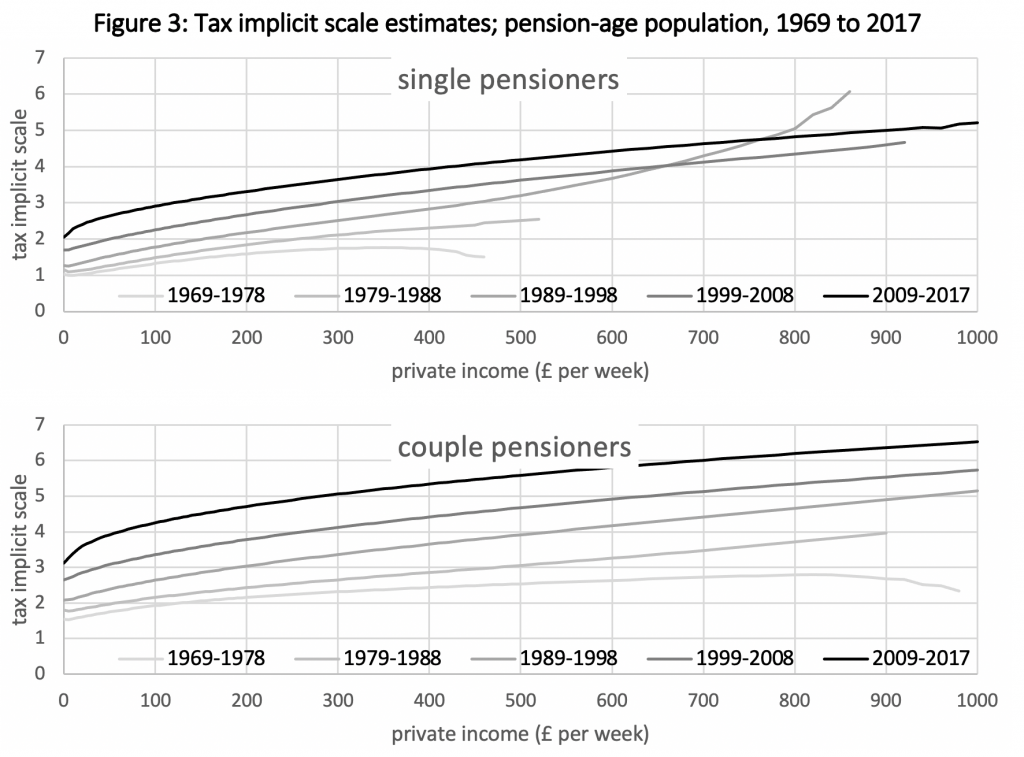


Notes: As for Figure 1. Single pensioners, defined as households comprised of single adult aged 65+. Couple pensioners defined as households comprised of two adults, at least one of whom is aged 65+.Source: Authors’ calculations using Living Cost and Food Survey data (LCF, EFS, and FES).
Starting at zero private incomes, the tax implicit scales estimated for the working-age population (Figures 1 and 2) describe little temporal variation during the first three decades to 1998. Interestingly, estimates for each of these scales during that time are similar to the proportional income adjustments that are commonly used to reflect differences in resource needs across Europe. This apparent correspondence is consistent with Beveridge’s stated objective that social insurance allowances should reflect differences in consumption needs.
However, since the 2000s, tax implicit scales for families with children and no private income have increased appreciably. This trend reflects a deliberate policy shift in favour of low-income families with children, especially following the election of New Labour in 1997. Furthermore, tax implicit scales for later years (especially 2009-2017) are found to rise with low to modest private incomes, rather than falling as they did in the 1970s and 1980s. This reflects the emphasis on in-work benefits for low-income families observed during recent decades, which ostensibly recognises the additional hurdles to employment that are associated with child-rearing.
Another key trend is that tax implicit scales for working-aged families in the 1970s tended to rise toward the top of the considered income range, whereas they tend to fall with higher incomes in the most recent data. This alteration in profile is driven by the shift from joint to individual income tax assessment implemented in 1990, and an increasing reliance on means-tested benefits at the expense of universal services provision.
The shift toward downward sloping tax implicit scales with income is consistent with the view that household demographics become less pertinent for evaluating tax and benefit payments at higher levels of private income. Interestingly, this view also reflects an emerging consensus from literature that evaluates the relationship between family demographics, income, and consumption needs.
We also find a pronounced shift of the UK tax and benefit system in favour of households with members above state pension age, relative to single working-age adults (the reference group). Figure 3 suggests that this shift applied fairly consistently, both through time, and across the private income distribution.
To put the results in perspective, by 2009-2017, the average tax implicit scale estimated for pensioner couples with private income of £900 per week was 6.4 (adjusted to 2018 prices). This implies that these pensioner couples were subject to the same average effective tax rates as single working-age adults without children earning (only) £140 per week. In contrast, the same pensioners would, given the tax implicit scales estimated for 1969-1978, have been treated equivalently to single working age adults with private income of £340 per week. These findings reflect increases in the generosity of state retirement benefits, relative to unemployment benefits. They also reflect maturing of the state pension system, as (contributory) state pension benefits are aggregated with other state benefits in the analysis.
Reforms to tax-benefit policy implemented since 2000 have succeeded to off-set rising private income inequality and reduce poverty rates among some of the most vulnerable population subgroups. They have also been structured to support employment and limit the burden on the public purse. These are all desirable objectives.
Nevertheless, it is important not to lose sight of the fact that a key tenet underlying the legitimacy of tax-benefit policy is that people of similar financial means should be treated similarly by a tax-benefit system (the principle of horizontal equity). The scales that we report clarify the ways in which the definition of ‘similar financial means’ implicit in UK tax-benefit policy has evolved during the last half century. The question that then remains is: does the observed evolution appear reasonable? That is a question that only public policy debate can resolve.
_____________________
Note: the above draws on the authors’ published work in Oxford Economic Papers.
Nicolas Hérault is Associate Professor at the University of Melbourne.
Justin van de Ven is Fellow at the National Institute of Economic and Social Research.
Photo by StellrWeb on Unsplash.


