 The U.S. is famous for being the country with the highest incarceration rate in the world – but what has driven the massive expansion of imprisonment in the last forty years? In new research that tracks public attitudes, Peter K. Enns finds that the public’s punitiveness is closely related to changes in the incarceration rate. He suggests that this stems not only from voters enacting laws such as ‘Three Strikes’, but also through the influence on criminal justice policy of state and federal legislators, who rely on public support for reelection.
In the 1970s, the United States began what has been called the grand prison experiment—nearly 40 years of unprecedented expansion of the criminal justice system. As a result, the U.S. now incarcerates a higher proportion of its population than any country in the world. For decades, scholars have wondered what led to this punitive turn. After all, maintaining the world’s highest incarceration rate carries enormous fiscal, social, and political costs. Furthermore, scholars do not even agree whether or to what extent incarceration deters crime. In fact, some researchers have found that incarceration may actually increase criminal activity.
I propose that to understand the rise of mass incarceration in the United States, we must look to the American public. In recent research, I show that the U.S. public’s support for being tough on crime—i.e., the public’s punitiveness—has been a fundamental determinant of changes in the incarceration rate.
Many criminal justice scholars may view this conclusion as a surprise. A long research history questions the relationship between public opinion and mass incarceration in the U.S. Nevertheless, I propose that there are many ways that the public’s attitudes can influence the criminal justice system. Sometimes the link between the public and criminal justice policy is direct, such as when voters enact Three Strikes Laws, which require a sentence of 25 years to life for a third felony conviction. Another channel of public influence can result through federal and state legislators, who depend on the public for re-election. These legislators influence criminal justice policy—and the incarceration rate—through criminal justice budget allocations, by defining what is a crime, and introducing mandatory minimum sentences. We might also expect prosecutors and judges to consider the public’s preferences. Not only do many states elect their judges and chief prosecutors, but research shows that even the decisions of the U.S. Supreme Court—where justices enjoy life tenure—correspond with the public’s policy preferences. In sum, a variety of paths exist for the public’s punitiveness to influence criminal justice outcomes.
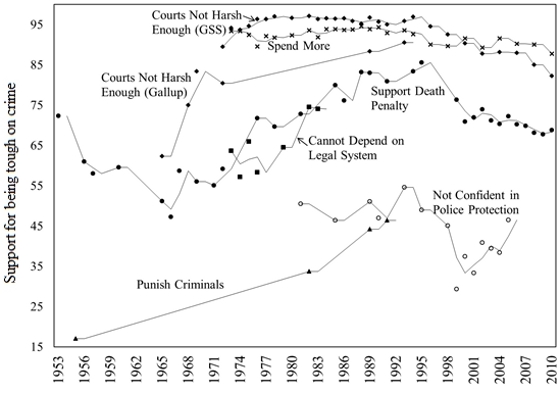
To test the influence of public opinion, we need an over-time measure of the public’s punitiveness. As a first step, Figure 1 plots the percent offering the punitive response to different measures of tough on crime attitudes: support for the death penalty, punishing criminals, spending more to halt crime, belief that the courts are not harsh enough, and lack of confidence in the police and legal system (which have been shown to correspond with an increased demand for being tough on crime).
Figure 1 – Seven Indicators of Support for Being Tough on Crime, 1953-2010

Note: Figure shows percent offering the punitive response divided by the percent punitive plus percent non-punitive.
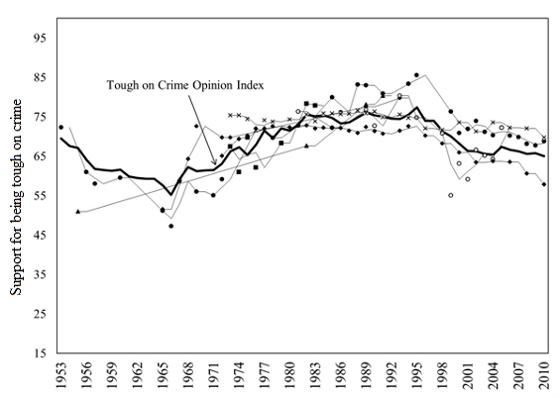
It is difficult to assess whether the survey responses in Figure 1 tell a coherent story about the public’s attitudes. We must remember, however, that to understand changes in the incarceration rate, we must focus on opinion change. Thus, the different levels of punitiveness depicted in Figure 1 are not of interest. What matters is whether the public is moving in a more or less punitive direction. To understand the over-time patterns in the data, Figure 2 presents the exact same survey responses shifted to a common point on the y-axis. The result is striking—all seven opinion series move virtually in tandem. By analyzing the common over-time movements in the separate public opinion series it is possible to measure how the public’s support for being tough on crime has changed over time.
Figure 2 – Seven Indicators for Support for Being Tough on Crime (Set to a Common Intercept) and an Overall Measure of Support for Being Tough on Crime based on 33 Indicators, 1953-2010

The solid black line in Figure 2 presents a measure of the public’s punitiveness based on these seven survey questions plus 26 additional survey questions that also ask about the criminal justice system. All 33 questions were asked at multiple time points—a total of 381 times since 1953. The overall measure of punitiveness reflects the common over-time movement of all 381 survey questions (to generate this measure, I used a statistical technique developed by Jim Stimson, that generates an index based on the common over-time variation across question series).
The next task is to evaluate whether these punitive public attitudes correspond with changes in the incarceration rate. I focus on change in the incarceration rate because during most of the period of analysis, more individuals were admitted each year than released. More admittances than releases means that even if the rate of new incarcerations declined or remained the same—perhaps because the crime rate dropped or punitive attitudes receded in previous years—the total incarceration rate would still increase. Thus, an analysis of the overall incarceration rate can lead to inaccurate conclusions because the overall incarceration rate can move in the opposite direction of the rate of new incarcerations. Fortunately, analyzing the change in the incarceration rate obviates this problem.
Figure 3 plots the public’s punitiveness and the change in the incarceration rate. Strong similarities emerge. The correlation is an impressive r=0.82. Statistically, this relationship holds even when controlling for the crime rate, illegal drug use, economic inequality, and the strength of the Republican Party. Based on this statistical model, if the public’s punitiveness had stopped rising in the mid-1970s, we would expect approximately 185,000 fewer incarcerations each year—about 20% of the incarceration rate. The expected influence of the public’s attitudes is larger than any of the other variables in the statistical model. Furthermore, an analysis of the public’s punitiveness and congressional hearings on crime suggests that public support for being tough on crime precedes congressional attention to this issue.
Figure 3. Public Support for Being Tough on Crime and Changes in the Incarceration Rate, 1953-2010

Importantly, in addition to helping us understand the expansion of the U.S. carceral state, the public’s punitiveness may also help explain more recent developments in the U.S. criminal justice system. As Tim Newburn has noted on this blog, some politicians and policies are beginning to reflect a shift in a less punitive direction. This shift is consistent with the declining public punitiveness observed above. In fact, if the public’s punitiveness had not declined in recent years, we would expect even more individuals would have been incarcerated.
Since attention to public opinion can help us understand the rise of mass incarceration in the United States, one might then wonder whether the public’s influence on the incarceration rate is a model of democratic responsiveness or evidence of the tyranny of the majority. There is good reason to be concerned that it is the latter. Not only has the prison population increased dramatically, but the composition of the prison population has shifted as well. In the 1950s, the prison population was majority White. Today, African Americans and Latinos comprise the majority of those incarcerated in the United States. Despite the important influence of public opinion, it is hard to reconcile this fact with democratic ideals.
This post is based on the forthcoming paper, ’The Public’s Increasing Punitiveness and Its Influence on Mass Incarceration in the United States’ American Journal of Political Science (ungated).
Featured image credit: Chris Frewin (Creative Commons BY NC ND)
Please read our comments policy before commenting.
Note: This article gives the views of the author, and not the position of USApp– American Politics and Policy, nor of the London School of Economics.
Shortened URL for this post: http://bit.ly/ShV2z8
_________________________________________
About the author
 Peter K. Enns – Cornell University
Peter Enns is Assistant Professor in the Department of Government at Cornell University. His research and teaching interests focus on public opinion, representation, and quantitative research methods. In particular, he is interested in whose policy preferences change, why, and whether government responds to these changes. He is also co-editor of the book, Who Gets Represented? (Russell Sage Foundation, 2011).


This has to be the most simplistic research ever. It explains nothing. The research question here is *why* the public has tracked the way it has on punitiveness, not whether they have and it’s affected incarceration rates.