

 Who will be the next US President? Some commentators have argued that voter intention polls are flawed because it is difficult to know who will actually turn out to vote. To get around this problem, Andreas Murr, Mary Stegmaier, and Michael S. Lewis-Beck use citizen forecasts, a “who do you think will win” survey question, to predict the election result.
In this US presidential election season, an unprecedented amount of attention has been focused on forecasting the outcome. While different approaches have been popular—vote intention polls, prediction markets, structural models, betting markets— the lion’s share of the attention has gone to the almost daily vote intention polls, as analyzed by data journalists. While this may make for good news copy, we know that even the best vote intention polls, such as those following the scientific cannon and fielded a few days before the election, can fall victim to noteworthy forecasting error. Thus, we believe it worthwhile to take a closer look at a neglected forecasting methodology—citizen forecasting. That is to say, look at which candidate citizens expect will win the race, rather than who they intend to vote for.
The evaluation of citizen forecasting, or voter expectations, has an increasing pedigree. After the first studies in the late 1990s in the United States, they crossed the Atlantic to Great Britain. A general finding for both countries holds: large majorities of voters are usually able to foresee which candidate (party) will win, in advance of the contest. Here we focus on the US case, and current work there, and present preliminary findings from experiments using Amazon’s Mechanical Turk (MTurk), where we pay respondents to answer questions on our repeated web survey.
The survey question of interest is as follows: “Who do you think will be elected President in November?” We have fielded this question daily, from August 19 to October 27, 2016, receiving a total of 595 responses. (The respondents are adult American citizens and they can participate in our repeated surveys no more than once). About 72 percent said that Clinton will win, in contrast to the 24 percent who said that Trump will win. Converted to the two-party proportion of respondents, this means that 74.8 percent predict a Clinton victory. Interestingly, although our MTurk sample does not pretend to be representative, this percentage falls very close to the long-term average for such an item from the American National Election Study (1952-2008), whose surveys do attempt to be representative. This close parallel between the two estimates, which could of course be coincidence, does suggest that the rationale behind our MTurk strategy— the Wisdom of the Crowds coupled with the Condorcet Jury Theorem — may not be without validity.
How does this two-party expectations proportion translate into the aggregate Clinton vote share? Fortunately, a strong link between Vote Expectation Share and Popular Vote Share has earlier been shown. Therefore, we simply update this work, regressing the two-party popular vote share (from the American Presidency Project) on the national voter expectation forecasts from the ANES Time Series Cumulative Data File (1952-2008; no forecast item was available there for 2012). Our regression results appear in Figure 1.
Figure 1 – Correlation between Vote Expectation Share and Popular Vote Share
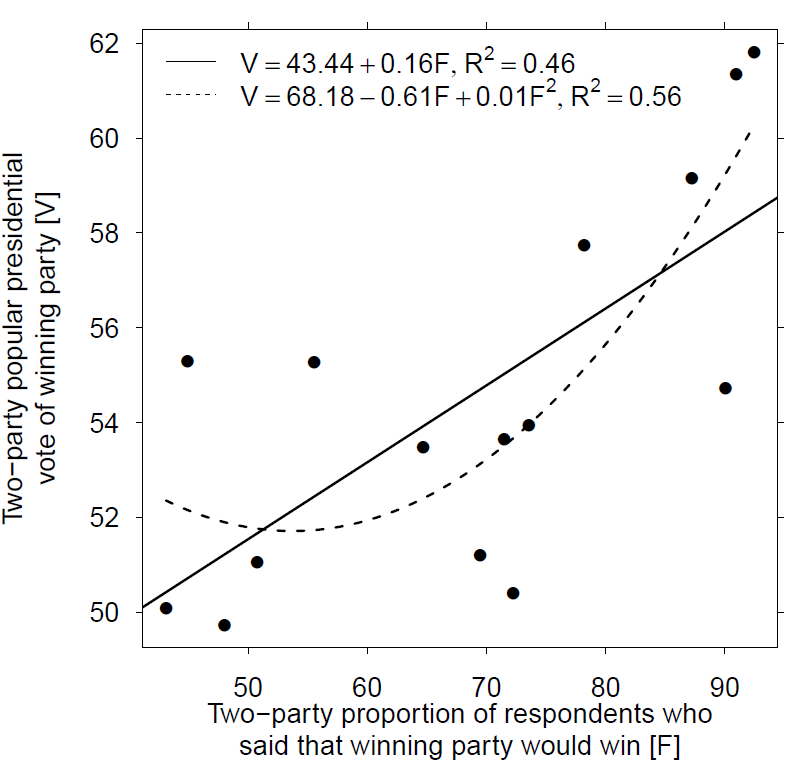
The relationship is rather strong and clearly curvilinear (see the second equation and the broken line). We use the curvilinear equation to predict the Clinton share by simply plugging in her voter expectation estimate (of 74.8), yielding a two-party popular vote share of 54.4 percent. In other words, a comfortable, but not overwhelming, victory for Clinton. Interestingly, this contrasts with the current two-party popular vote split, based on the voter intention aggregate reported in Real Clear Politics. As of October 31, 2016, it shows 47.5 percent for Clinton, 45 percent for Trump, the rest undecided. Among those who have decided, the Clinton margin becomes 51.4 percent (47.5/(47.5+45) = 51.35).
How does our expectations-based estimate of the popular vote share translate into electoral votes? We know the national two-party popular vote share predicts the national Electoral Vote share almost perfectly, yielding the following formula, Electoral Vote Percentage = -198 + 4.88 * (Popular Vote), across the 1948-2012 US presidential elections. If we plug in our above popular vote estimate of 54.4 percent, the forecast for Clinton’s Electoral Vote share equals 67.3 percent of that vote, or 362 of the 538 electoral votes.
Thus, based on the citizen forecasting model, we predict that Clinton will win 54.4 percent of the two-party vote, which translates into 362 Electoral College votes. Certainly a strong win, but by no means a landslide.
Featured image credit: Hillary for America (Flickr, CC-BY-NC-SA-2.0)
Please read our comments policy before commenting.
Note: This article gives the views of the author, and not the position of USAPP– American Politics and Policy, nor of the London School of Economics.
Shortened URL for this post: http://bit.ly/2fgjRrW
______________________
Andreas Murr – University of Warwick
Andreas Murr is Assistant Professor of Quantitative Political Science in the Department of Politics and International Studies at the University of Warwick. His research focuses on election forecasting, the voting behavior of immigrants, and the selection of party leaders.
Mary Stegmaier – University of Missouri
Mary Stegmaier is an assistant professor in the Truman School of Public Affairs at the University of Missouri. Her research focuses on voting behavior, elections, forecasting, and political representation in the U.S. and abroad.
Michael S. Lewis-Beck – University of Iowa
Michael S. Lewis-Beck is F. Wendell Miller Distinguished Professor of Political Science at the University of Iowa. He has authored or co-authored over 270 articles and books, including Economics and Elections, The American Voter Revisited, French Presidential Elections, Forecasting Elections, The Austrian Voter and Applied Regression.


“To get around the problem of inaccuracies in polling, we use a method that is even LESS accurate.” Good thinking. Instead of using a method that asks how a person will act, you are using a method that asks how people think others will act. The “wisdom of the crowd” theory is patronizing, because what you really mean is “the absurdity of the crowd”.
The “wisdom of the crowd” theory is quite prevalent in this article, where three people with some sort of credentials get together and come up with the most idiotic polling idea of the entire election cycle.
Nice charts and graphs!