 Looking at the change in the UK inflation rate against the UK unemployment rate over the 1971-2012 period, Costas Milas examines the implications of the Bank of England’s forward guidance and why the 7% threshold was chosen. The empirical results offer support to the recent decision by Mark Carney and his MPC colleagues.
Historical inflation and unemployment rates confirm that inflationary pressures rise dramatically when unemployment falls below the 7% threshold.
In early August, newly appointed Bank of England Governor Mark Carney and his Monetary Policy Committee (MPC) colleagues announced that monetary stimulus (in the form of a low policy interest rate and/or Quantitative Easing injections) will remain in place (at least) until the UK unemployment rate drops from the current 7.8% level to 7%. This, as long as inflation and/or inflation expectations do not “take off”. Why did the Bank of England Governor choose the 7% “threshold” and what are (if any) the implications of such a decision for UK inflation?
To answer these questions I rely on historical UK inflation and unemployment rate data. Figure 1 plots, using annual data, the change in the UK inflation rate against the UK unemployment rate over the 1971-2012 period. Notice that I have super-imposed a simple linear regression line which suggests that high inflation is associated with low unemployment (and vice versa).
Figure 1: Change in the UK inflation rate against the UK unemployment rate, 1971-2012
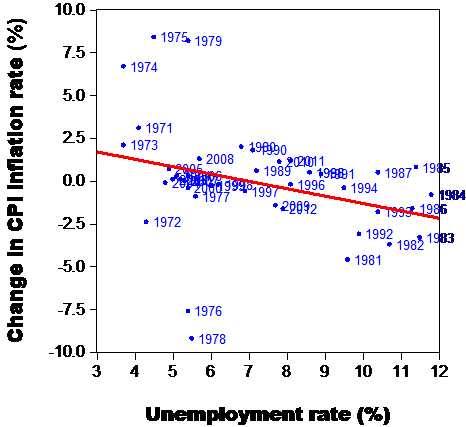 This trade-off between inflation and unemployment rates is known as the Phillips curve. Arguably, the model is too simple to capture the (complex) relationship between inflation and unemployment. Before dealing with this issue, however, I note that the historical average of the UK unemployment rate is 7.2% (its median is 6.85%). In other words, the 7% “threshold” chosen by Mark Carney and his MPC colleagues is pretty consistent with what UK economic history (over the last 40 years or so) suggests.
MPC policy-makers (seem to) worry that inflation pressures “take off” when the unemployment rate falls below the “7% threshold”. To test this hypothesis, I rely on a regime-switching backward-looking Phillips Curve which allows for the impact of unemployment on inflation to vary depending on whether the unemployment rate is higher or lower than the 7% threshold (for those interested in the technical model, I estimate an inflation equation where inflation depends on an intercept term, lagged inflation, and lagged unemployment with the latter changing impact above or below 7%). The empirical results offer support to the recent decision by Mark Carney and his MPC colleagues. To summarise:
Above the 7% unemployment rate threshold, a drop in the unemployment rate from its current 7.8% level to 7.3% puts a very gentle upward pressure on inflation by (only) 14 basis points (that is, inflation increases from its current 2.8% level to 2.94%).
On the other hand, the impact turns quite dramatic once unemployment falls below the 7% threshold (in which case the economy shows signs of significant “over-heating”). In this case, a drop in the unemployment rate from 7% to 6.5% puts a dramatic pressure on inflation as the latter shoots up by a full percentage point.
All the above offer overwhelming support to the decision by Mark Carney and his MPC colleagues to “watch out” for the 7% unemployment rate threshold. Needless to say, a sceptical reader might question the 7% threshold on the grounds that it has been an arbitrary choice. After all, Ben Bernanke and his Federal Reserve colleagues have chosen to provide further monetary stimulus until the US unemployment rate drops to 6.5%. To deal with this point, I allow the data to decide. That is, I allow for the threshold to be jointly estimated with the impact of unemployment on inflation. Doing so delivers an unemployment rate threshold of 6.8% which is pretty consistent (both numerically and statistically) with the 7% threshold.
Note: This article gives the views of the author, and not the position of the British Politics and Policy blog, nor of the London School of Economics. Please read our comments policy before posting.
Costas Milas is Professor of Finance at the University of Liverpool Management School. Email: costas.milas@liverpool.ac.uk


Whenever I see macro people talking about NAIRUs and Phillips Curves, I always think they need to look a lot harder and longer at the microeconomics of the labour market before they bring their aggregate time series econometrics to bear on it, however sophisticated that is. Even macro people have known about hystereisis since the 1970s, albeit they’ve had impossibly crude views about what causes it and therefore of its policy implications.
Plus there is also this: the welfare losses from unemployment and from the distributional effects of the appropriation of matching rents by employers are so large, even at the NAIRU, that the welfare losses from a spell of 4-5% inflation consequent on running loose policy a bit too long are simply trivial in comparison. Central banks always seem to think the worst thing they could do is overshoot the NAIRU, but in the wake of a recession I think they should be aiming at precisely that in order to then approach it from below, not above. You have to undo the hysteresis the recession created – getting over to the left on the short run Phillips curve actually will shift it in.
All we are saying is give growth a chance.
The main point here is that, historically, inflation takes off when the 7% threshold is crossed. Therefore, and in contrast to what Mr Carney stated in his visit to the Midlands yesterday, the MPC should respond “aggressively” once unemployment reaches 7%.
Inflation rises as unemployment falls because the suitability of unemployed labour deteriorates, and eventually induces employers to bid up the price of “already employed” labour (e.g. by poaching labour from each other) rather than take labour from the dole queue.
Ergo NAIRU can be reduced by subsidising the unemployed into work: that would make up for the above “unsuitability”. The latter would not be easy to in practice, but the theory is great.
Unfortunately I’m the only person in the world who grasps that little bit of theory, far as I know: i.e. the rest of the world is too dumb to see it.
Each time I read about unemployment rates, I become concerned as to how the Gray Market is vectored in, other than a wave of the ceteris paribus hand and a if I am fortunate a “well, we can’t measure that, so we assume that the Gray Market is constant. Not so, at least in the United States. Perhaps there is such a field as quantum economics.
People work for cash wages, businesses adjust reported sales and income in order to accommodate this. the GDP is affected. The objective is to maximize after tax income for the individual and the household. As government programs change the eligibility requirements, extend the term of a welfare payments program, etc., people do act rationally.
It is clear that in America when household balance sheets shifted because the value of the primary asset, the homestead fell below the value of the liability (the mortgage) while the level of the ‘never-never’ remained high, equity went negative. Consumption patterns changed. The ‘never-never’ was used less and paid down.
Our Fed and the Treasury did everything possible to re-liquify the financial sector and induce it to make loans, but it is like pushing on a string. The housing sector will not be invigorated until the households decide to join the dance once more.