 Since the global financial crisis, workers’ real wages and family living standards in the UK have suffered to an extent unprecedented in modern history. Real wages of the typical (median) worker have fallen by almost 10 per cent since 2008; and real family incomes for families of working age by almost the same. In this article, part of CEP’s Election Analysis, Stephen Machin discusses what has happened to real wages and family incomes, and links the patterns of change to the current policy debate.
Falling real wages
Figure 1 shows that median real wages grew consistently by around 2 per cent per year from 1980 to the early 2000s. There was then something of a slowdown, after which real wages fell dramatically when the economic downturn started in 2008. Since then, real wages of the median worker have fallen by around 8-10 per cent (depending on which measure of inflation is used as a deflator – the consumer price index, CPI, or the housing cost augmented version CPIH). This corresponds to almost a 20 per cent drop relative to the trend in real wage growth from 1980 to the early 2000s.
Figure 1: Annual ASHE median real weekly earnings, 1980 to 2014
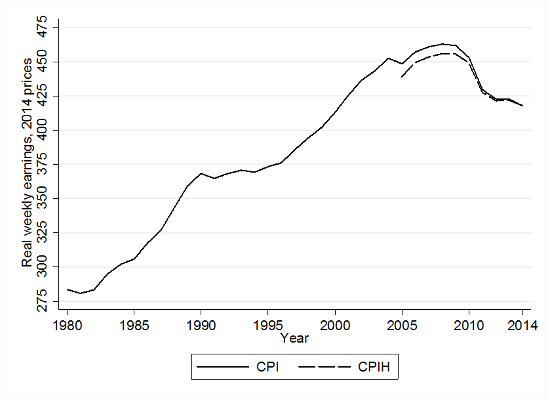
Notes: Annual Survey of Hours and Earnings (ASHE) weekly earnings numbers, updated from Gregg et al (2014a, 2014b), deflated by CPI and CPIH (from 2005).
Figure 2 focuses on the recent experience using monthly official average weekly earnings (AWE) numbers deflated by CPI. Growth in AWE outstripped consumer price inflation growth until June 2008. From July 2008 onwards (with the exception of two months, March and April 2010), real wages did not grow until the most recent October, November and December 2014 numbers. Growth in wages in the last quarter of 2014 just about crept above CPI growth, and this is mainly because price inflation has been falling, rather than arising from any notable strength in nominal wage growth.
Figure 2: Three-month nominal AWE and CPI growth, 2002 to 2014
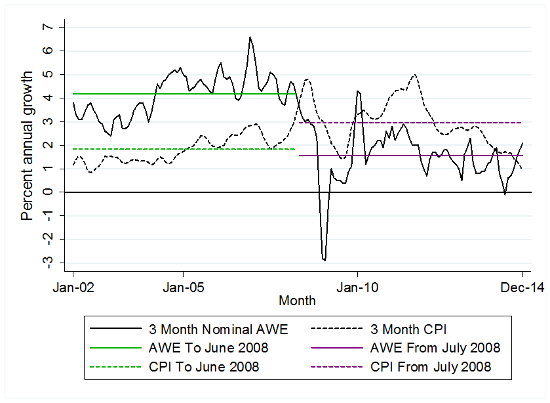
Notes: AWE and CPI numbers (three month averages) from ONS.
Table 1 shows variations across different groups of workers. Men have seen larger falls in real wages (12 per cent) compared with a fall of 7 per cent for women. The young have been hit hardest, with a 16 per cent fall for those aged 18-24. Young people have faced a double whammy, taking the brunt of the unemployment increases that have occurred in this downturn (which overall have been more modest than in the previous two recessions of the early 1980s and 1990s), alongside big real wage falls.
Table 1: Percentage falls in median real wages by group since 2008, ASHE
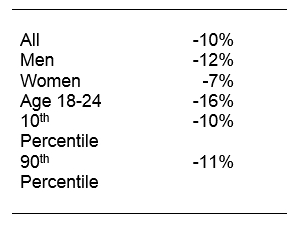
Notes: Updated CPI deflated numbers from Gregg et al (2014b).
Real wage falls have occurred right across the earnings distribution, dropping by 10 per cent at the 10th percentile and 11 per cent at the 90th percentile. Interestingly, these similar falls (and that of 10% at the median) imply that wage inequality, measured by the difference between the two, has not gone up during the downturn. This contrasts with long-run wage inequality trends since 1980, which peaked at the start of the downturn.
Since the global financial crisis, UK wages have fallen by more than in other OECD countries. Figure 3 uses comparable hourly earnings data for 2008 to 2013 for 26 countries. The UK’s relative performance is very poor, placing 23rd above only Hungary, the Czech Republic and Greece.
Figure 3: International real hourly earnings growth, 2008-13
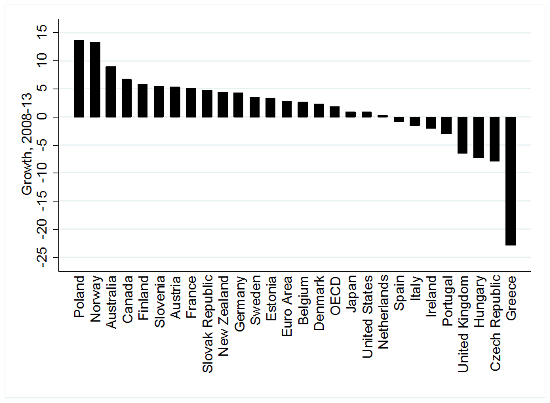
Source: OECD Employment Outlook, 2014.
Recent falls in unemployment
Figure 4 shows that the fall in unemployment that has occurred since 2012 has had no discernible impact on improving real wage growth. In the recessions of the early 1980s and 1990s, real wages grew as unemployment fell, but this has not happened so far. Median real wages have actually dropped a little as the unemployment rate has come down from its peak.
Figure 4: Median real wages and the unemployment rate, 1980 to 2014
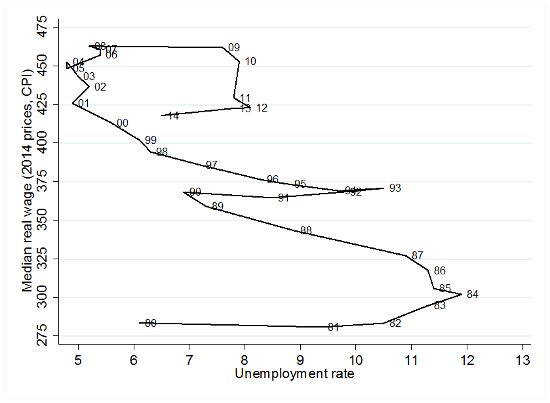
Notes: Median wages from ASHE, ILO unemployment rates from ONS.
These overall patterns of change, when coupled with the UK’s continued poor productivity performance (see CEP’s Election Analysis on Productivity and Business Policies), do not paint a promising picture of wages picking up significantly during the election campaign and beyond.
Family income
Overall, median family incomes have not fallen by quite so much as median wages. Table 2 shows that median real (after-tax) income fell by 4 per cent between 2007-08 and 2012-13. The smaller fall is partly due to the tax-benefit system’s automatic stabilisers (at the start of the downturn), to tax changes that increased the annual personal allowance (which in turn has reduced income tax receipts) and importantly because pensioner households have actually fared much better than working age households.
For a consistent definition between 2007-08 and 2012-13, there was a fall of 7 per cent in real incomes for the working age group, while the pensioner age group experienced a 4 per cent increase. The real income gains of pensioners arise from three factors: first, state pensions were linked to inflation under the ‘triple lock’; second, older workers were increasingly likely to be working in (mostly) part-time jobs; and third, as the personal allowance rose, this work income became less likely to be taxed.
Table 2: Percentage changes in median real family income by group, 2007-08 to 2012-13
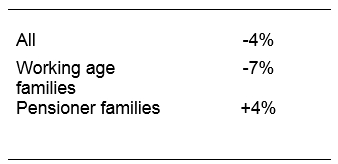
Notes: Based on Family Resources Survey, from Belfield et al (2014) with additional numbers provided by Robert Joyce. Calculations of the percentage falls in median real income are after tax and before housing costs.
The clear picture, however, is that poor real wage performance has also mapped into reduced living standards measured by overall family income for the working age group. From the political perspective, falling real wages and reduced living standards are one and the same, and they can be traced back to worsening rewards for workers in the labour market.
The election context
All parties recognise that less money from work going into people’s pockets is an important political issue. That said, at the moment, none of the parties are particularly coherent on what can be done substantively to improve the real wage position of UK workers.
There are piecemeal policies on the table that could improve some aspects of the poor real wage position. Some policies that have been discussed are: higher national minimum wages; increases in minimum wages in higher cost areas (for example, ‘living wages’ in London); and employers taking on a responsibility to pay more (for example, firms who benefited from the recent oil price drop) or more generally sharing out more profits with all workers. For family income, there are also the usual ‘making work pay’ arguments around taxes and benefits.
Some of these policies are potentially useful. But the real key to generating substantial gains that could make serious inroads into getting back to 2008 levels is raising productivity and, if a productivity boost does come, ensuring that workers across the entire wage distribution share in the gains. One worrying feature of research in this area suggests that well before the downturn, economy-wide median wage growth became more weakly correlated with economy-wide productivity growth.
Increased productivity must be a necessary condition for a return to wage growth. Thus, policies to raise productivity – especially those linked to skills (for example, building human capital for those with poor basic and intermediate skills) – are important. But productivity improvements may be insufficient to raise wages if the benefits are mainly appropriated by shareholders or pensioners.
Even if average wages increase, these may benefit median workers by much less if wage inequality once again starts to rise. The ‘Britain needs a pay rise’ campaigns and even the discussion around raising the pay of workers in companies that have benefitted from the drop in the oil price are useful for policy debates to raise awareness on these issues.
Finally, improving the labour market prospects and opportunities for young people is an important policy aim. In the longer run, this is down to education and skill acquisition. But there are labour market policies – such as raising minimum wages and offering properly funded apprenticeship and vocational skills programmes – that could play a major role in repairing some of the damage done by the combination of sizable real wage falls and poor employment opportunities that have hit the wages and living standards of the young so badly.
Note: This article gives the views of the author, and not the position of the General Election blog, nor of the London School of Economics. Please read our comments policy before posting.
Stephen Machin is CEP’s research director, professor of economics at University College London and a member of the Low Pay Commission.
[1]CPIH is a new (since 2005), non-official, price index, which adds owner-occupiers’ housing costs to the CPI. The 2008-14 fall is -9.7% for CPI and -8.5% for CPIH.
[2]AWE is the average weekly earnings index produced by the Office for National Statistics (ONS).
[3]These two months show growth because of the big fall in the corresponding months ofthe previousyear,which was driven by bonuses falling that year (See Taylor et al, 2014).
[4] Chris Giles in the FT has pointed out that the choice of different income measures (for example, before or after housing costs), inflation measure and how the most recently available 2012-13 Family Resources Survey numbers are uprated can result in different conclusions being drawn on what real income trends say about falling living standards. But the main point made here – that the trends in family incomes for working age households are more in line with wage trends – remains the case (and also the case, therefore, that pensioner families have done relatively better).
[5] See Pessoa and Van Reenen (2013) and Gregg et al (2014b).


great write up! also what are your thoughts on the new interest rate fluctuations in all developed countries. Australia is also jumping on the bandwagon of changing rates every now and then, lots of uncertainty in the housing market all this because of the real wages vs living standards in many western countries.
Stephen, I see that it’s possible for median salary to decrease in future, particularly in 1st world countries, over 5, 10 or more years(Rather than the real wage alone). The majority of people I speak to though argue that income can’t come down, it just keeps going up with inflation. What are your thoughts?
I wouldn’t say it would decrease but it may slow down for the near future before any real progression. It really depends on how far and where inflation moves, and real wages as the article suggests