 In the past two years we have had two official ‘stock takes’ of equality from the National Equality Panel and the Equality & Human Rights Commission, revealing the true contours of inequality in Britain. But with 1200 pages of detailed data, it can be difficult to see the big picture. Ben Baumberg summarises the messages from LSE’s key contributors to the reports, and argues that policy needs to reflect both the broad canvas and the individual brush strokes of inequality in order to successfully tackle it.
If you’re interested in inequality in Britain, then your twin bibles should be the 1200 pages of data and analysis from the National Equality Panel, An Anatomy of Economic Inequality in the UK, and from the Equality & Human Rights Commission(EHRC), How Fair Is Britain?, both published last year. But the chances are you haven’t read them. Indeed, it seems unlikely that anyone – let alone current frontline politicians – will have pored over the carefully prepared glossy charts page-by-page, due to the sheer enormity of information available.
To act on the evidence, it is crucial to ‘tell evidence-based stories’ based on this data. Two leading academics from LSE recently did just that: Professor John Hills, the Chair of the National Equality Panel, and Dr Polly Vizard, whose work underpins the EHRC report, spoke at the LSE’s Britain: A Country Divided? event. Here their views from the event are shared, before a discussion about what this all means for tackling inequalities in contemporary Britain.
Economic inequality
In 2008, the then Equalities Minister Harriet Harman set up the National Equality Panel to examine how economic outcomes related to social characteristics (covering gender, age, ethnicity, religion or belief, disability status, sexual orientation, socio-economic class, housing tenure, nation or region, and level of deprivation in the neighbourhood), with the results wonderfully visualized by the Guardian. John Hills revisited the 16 challenges for policy that were posed in the report to see how the coalition government are doing. The results were fascinating, but confusing.
These 16 challenges covered the entire life span – from schooling and education, through to the labour market, on to resources in later life, and the distributional effect of taxes and spending. On some of these issues the coalition government already has a poor record. To take but one example, shorter-term tenancies do not support people in social housing into work; indeed, they introduce strong incentives in the opposite direction, into long-term unemployment and insecurity. But on other issues the government’s record is much better. They have introduced the ‘triple lock’ on yearly increases in the basic state pension, and have protected universal benefits for the elderly like winter fuel payments.
Looking across the life span is essential because “economic advantage and disadvantage reinforce themselves across the life cycle, and often on to the next generation. By implication, policy interventions to counter this are needed at each life cycle stage” (p386 of the report). But when we have such a messy picture – of multiple inequalities at each of multiple periods of life, with multiple policies acting on them in multiple directions – how do we understand the record of the coalition as a whole?
John Hills’ response was that in the short-term, it is the rebalancing of public finances that will have the biggest impact on inequality – and citing research by the Institute for Fiscal Studies, he suggested that the Coalition’s impact will be regressive. Yet the long-term impact is less clear, as I discuss below.
Wider inequalities
The National Equality Panel was asked to focus on economic outcomes – but obviously this is only one piece of the jigsaw of inequality in Britain. Complementing John Hills’ presentation, Polly Vizard presented the Equality Measurement Framework that she has developed (with colleagues) for the EHRC, and which underpins the vast EHRC triennial review.
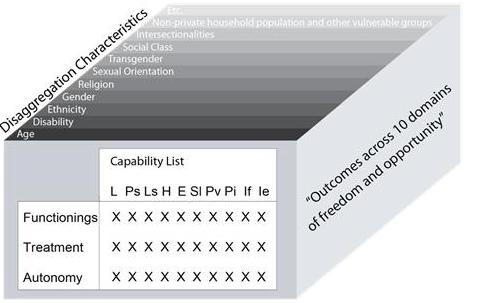
The Equality Measurement Framework is a systematic attempt to ask ‘what inequalities are we actually concerned about?’ – and fuses a deep philosophical understanding with research and consultation on what the British public actually think. At the core is Amartya Sen’s idea of ‘capabilities’ – that is, valuable things in life that people can actually do and be. More specifically, this means looking at:
- 10 domains of capabilities – such as life, physical security, and self-respect
- 3 aspects of each domain – (i) what people actually do (‘functionings’), (ii) how they are treated, and (iii) how much choice and control they have (‘autonomy)’
- 10 disaggregation characteristics – such as religion, class, etc.
Rather than a single number, then, we have a 50-part ‘indicator dashboard’ for each cross-cutting characteristic like class or disability (see Figure 1). Polly Vizard gave the example of the ‘capability to have a full life’, which is measured by life expectancy, infant mortality, homicide, accidental death, and death within institutions. The resulting figures do not just show the relative disadvantage among different groups, but also highlight the sheer existence of potential inequities that may otherwise be missed, e.g. deaths by dehydration in institutions .
Figure 1 – The ‘Inequality Dashboard’, suggested by Polly Vizard & colleagues as a way of looking at the inequalities that matter

The ‘Capability list’ refers to: Life; Physical security; Legal security; Health; Education; Standard of living; Productive and valued activities; Participation, influence, voice; Individual, family and social life; Identity, expression, self-respect.
Lights, data, action
It is impossible to take action on inequalities that are unseen. We simply cannot overestimate the importance of research like this – research that both defines what matters and then measures it, showing us in the starkest possible terms the inequalities that still exist in 21st century Britain. In an ideal world, these two reports would be on (and buckling) the shelves of every policymaker in the country.
Yet these individual brush strokes of inequality make up a bigger picture – and it is these big pictures, these ‘stories of inequality’, that most powerfully affects how we think about the world and underpin actual policy. (As Alex Stevens wonderfully describes in his recent ethnographic study of high-level policymaking). These reports are not themselves (and were not attempting to be) these bigger pictures, but are rather the building blocks of possible evidence-based stories about inequality in Britain.
There are nevertheless some clues as to possible bigger stories. As John Hills suggests, more unequal societies contribute to greater inequality at every life stage, leaving an uphill challenge for policy focused on equality of opportunity. I have argued over at the Inequalities blog that the challenge now is to find theories that deepen our understanding of how inequality builds up and sustains itself over the life course – so that policies to reduce inequality are not dealing with the symptoms in education, health etc, but rather change the underlying drivers of such inequalities.
It is these very issues that seem to underlie the launch of the Resolution Foundation’s Commission on Living Standards at which Ed Miliband spoke recently. But the Commission – and the various political parties listening closely to their results – would do well to heed Polly Vizard’s work, which shows we need to look at the unequal distribution of multiple valued outcomes, rather than settling on ‘living standards’ or any other single narrow definition of what matters.
With such theories in hand, we can evaluate whether a Government agenda as a whole is helping to make Britain a fairer society. In the meantime, though, these encyclopaedias of inequality are required reading for understanding today’s Britain.
A podcast of the event is now available.
Please read our comments policy before posting


1 Comments