 Much is being written about the fragmentation of the British party system in the run-up to the 2015 general election, but little about how that is reflected across the country’s constituencies where the election will be won and lost. To some, a three-party system had developed (four-party in Scotland and Wales) in the decades leading up to the 2010 election, but Ron Johnston and Charles Pattie find this is not the case across constituencies. Instead, England has three two-party systems with the voting in almost all constituencies dominated by just two parties and the other well back in third place. Those three systems – and comparable ones in Scotland and Wales – provide the matrix within which the 2015 election is being fought.
Over recent decades increasing numbers of commentators have referred to the British (basically English) party system as three- rather than two-party: some suggest it is a two-and-a-half party system. The growth in the Liberal Democrats’ vote share and number of seats justified this shift.
But that is overly-simplistic. ‘Three-party system’ implies that all three are competitive across the whole country, which is not the case. We actually have three two-party systems in England plus further, similar, situations in Scotland and Wales.
This is illustrated by two graphs. The first shows the changing number of constituencies over the period 1974-2010 according to which parties came first and second there at the relevant election. In 1974, some 500 of the c.630 seats had the Conservatives and Labour occupying those places, with around 100 having the Conservatives and Liberals there, and only a small number in the other types.
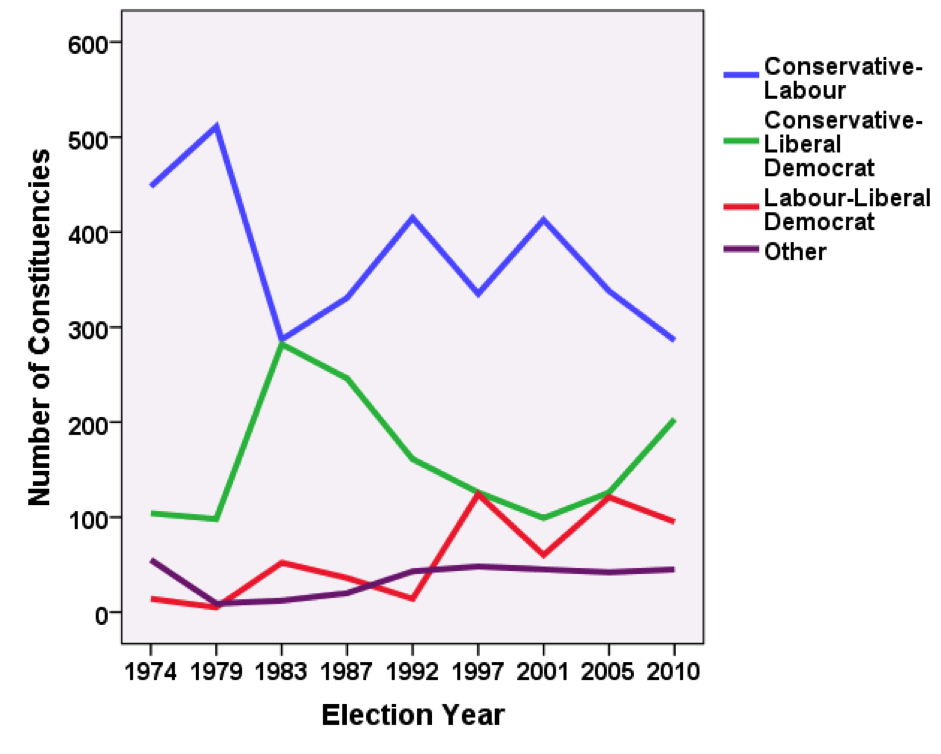
Labour’s nadir and the strong Alliance performance in 1983 saw an almost equal number of Con-Lab and Con-LD outcomes. The latter group then declined, but the number of Con-Lab contests never returned to its former height due to growth in both seats where Labour and the Liberal Democrats occupied first and second places and those categorised as Other.
This division into different contest types has two major features. The first is that almost all constituencies within each type had only two strong parties, with the others much weaker. (That weakness may partly reflect tactical voting. Over time, some who might otherwise vote for third parties realise that will bring no electoral benefits and switch to their second choice – and so the gap between first and third widens.) This is shown in the bar graph below, which gives each party’s average percentage of the votes in each contest type in 2010. In the Con-Lab contests, for example, the average Liberal Democrat vote share was only around half that of the other two. In all three types, two-party contests were the norm. (For the theoretically-inclined, Duverger worked locally, if not nationally.)
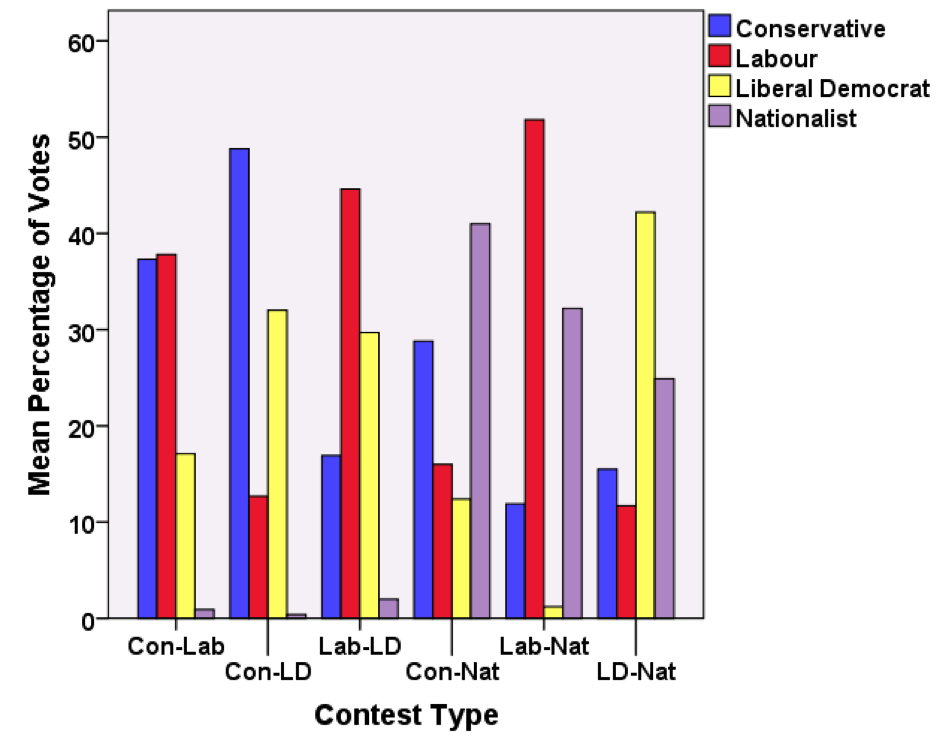
Indeed, in 2010 the gap between the first- and third-placed parties was under 10 percentage points in only eleven British constituencies, and was less than 20 points in another 67. Seats where all three parties had a reasonable chance of victory were rare.
The second feature is the geography of the contest types. Each was concentrated in particular regions and largely absent from others: there were only 10 Lab-LD constituencies among the 312 in the south of England outside London and the two Midlands regions, for example, and the Southwest had a clear majority of Con-LD contests. Almost all the Lab-LD contests were in the major cities – in England’s three northern regions, in London, and in Scotland. Urban areas had very few Con-LD seats – three-quarters were in county constituencies.
The situation going into the 2015 elections is thus of different types of constituency contests in separate parts of the country; each of the Britain-wide parties will have to tailor its campaigning messages to at least two different scenarios.
In the Con-Lab contests, for example, neither party will expect substantial gains from the other. Labour will campaign to capture disillusioned 2010 LibDem voters and will seek to staunch any flow from both its own supporters and the former LibDems to the Greens and UKIP, while hoping that former Conservatives shift substantially to UKIP. Unless UKIP makes major gains from either or both of the two front-runners (it averaged only 3 per cent of the votes in those seats in 2010), these should remain Con-Lab dominated constituencies with Labour having a good chance of success in the more marginal seats if it loses fewer votes to UKIP than the Conservatives (though UKIP hopes to repeat its Heywood & Middleton by-election performance and attract many disillusioned former Labour voters across its northern heartlands).
Those who voted Liberal Democrat in 2010 are unlikely to switch in large numbers to either the Conservatives or UKIP and as the Greens’ campaigns are likely to be fairly weak in many areas Labour is likely to be the main beneficiary of the LibDems’ declining support – other than in seats where popular Liberal Democrat incumbents can hold on. Many Con-LD constituencies in 2010 could move to the Con-Lab camp in 2015, therefore, unless there is a very strong UKIP performance, and many Lab-LD marginals last time could become safe Labour seats, with the Conservatives and Liberal Democrats vying for a poor second place.
Most commentators think the 2015 election will be very different in Scotland: the Liberal Democrats are likely to lose seats; the Conservatives will make very few, if any, advances; and all will depend on how many Labour seats the SNP can capture. In 2010 the Nationalists were less than 10 percentage points behind in none of them, however, and less than 20 points in only three, suggesting little realistic chance of a major shift of power in Scotland. But opinion polls since the independence referendum show a dramatic rise in SNP support, eclipsing Scottish Labour: even previously safe Scottish Labour seats might now be vulnerable to the Nationalists.
In Wales, the small number of polls suggest the LibDem vote may collapse from 20 in 2010 to just 5 per cent, with UKIP gaining a similar increase – not that LibDem voters are switching to UKIP; these are net gains. Labour could be the main beneficiary – increasing its hold where it won in 2010 with the LibDems in second place and perhaps gaining a further one or two seats.
That England had three different types of electoral contest in 2010, resulting in one of the three main parties being much weaker than the other two in large blocks of constituencies, has not been widely recognised. Much is being made by commentators of each party’s overall vote share in the opinion polls, on the possible switches between parties, the threat posed by UKIP on the right and the Greens on the left, and the particular situation in specific marginals. Less has been written about likely differences between how Labour fights the Liberal Democrats in the northern cities – where the Conservatives have only weak campaigning foundations, reflected in their absence from many Borough and City Council Chambers – and how it campaigns against the Tories elsewhere. Similarly how the Conservatives take on the Liberal Democrats in the very different contexts of rural and small town southern England will call for separate messages from those deployed where they are fighting Labour. And the Liberal Democrats face a very different challenge from Labour in the northern seats than they do from their erstwhile coalition partners in the south, and will have to modify their campaigning messages accordingly.
The 2015 election is ultimately about which of the two largest parties will be at the core of the next government – and therefore whether David Cameron or Ed Miliband will be Prime Minister – but the outcome will be determined by a number of very different contests and campaigns in separate parts of the country. After the last general election we had three different two-party systems in separate parts of England, and both Wales and Scotland had their own particular situations: after 7 May 2015 we may have a much more complex electoral geography.
Ron Johnston is Professor of Geography at the University of Bristol.

Charles Pattie is Professor of Geography at the University of Sheffield, specialising in electoral geography.


1 Comments