 Following up from his 2015 analysis on the economic and cultural positions of party supporters in England, Jonathan Wheatley uses 2017 data and finds that party supporters have become far more polarised. He also finds that there is a gap in the middle, occupied possibly by large numbers of undecided voters. It is that ’empty centre’ on the economic and cultural scales that Labour and the Conservatives will need to win over.
In an earlier blog I wrote after the 2015 general election, I described how political opinion is too complex to be described exclusively in terms of “left” and “right”. I argued that if you are “left” or “right” in economic terms, this does not necessarily mean that you will be in the same camp when it comes to issues of culture and identity. I proposed that we should consider two dimensions of political opinion.
The first is an economic dimension about whether you prefer pro-free market economic policies on the one hand, or redistribution of wealth and a greater role of the state in the economy on the other. The second is a cultural dimension, which I referred to as communitarian-cosmopolitan, but which other commentators have described as “open versus closed”. It concerns the relationship of your community with the outside world, draws on issues such as EU membership and immigration, and, to coin David Goodhart’s terms, is about whether you are “from Anywhere” or “from Somewhere”. Since the United Kingdom voted to leave the European Union and Donald Trump won the US elections last year, both political analysts and journalists have been discussing this dimension. Immediately after Brexit, the Economist published a leader entitled “The new political divide” in which the editors suggested that the “open against closed” now divide matters more than that between left and right.
In the earlier blog, I used the responses of users of a Voting Advice Application called WhoGetsMyVoteUK to a battery of policy items first to identify the issues that formed part of these dimensions (using a dimension reduction technique called Mokken Scale Analysis) and then to map the positions of the supporters of five parties (Conservatives, Labour, Liberal Democrats, UKIP and Greens) with respect to them. Party supporters were defined as those who a) listed a given party as being closest to them and b) said that they would vote for that same party. Their positions on the map are calculated from their opinions on relevant issues. The map (below) shows where they stood in the run-up to the May 2015 elections. The lines around the bubbles are “contour lines” that enclose 50% of the party’s supporters. We see that in 2015, the parties had very distinct positions on both dimensions, but at the same time there was a significant degree of overlap between the different groups of party supporters.
Diagram 1 shows the mean positions of each party’s supporters in 2015.

In the run-up to the forthcoming general elections, an updated version of WhoGetsMyVoteUK has been launched, and I am already able to explore the responses of the first 23,000 or so users to have taken part. As before, I look only at English parties as the app asked rather different questions in Scotland and Wales and the data from these two nations cannot be directly compared with the English data. Performing exactly the same analysis as I did for the 2015 data, I identify very much the same dimensional structure as before with issues relating to redistribution of wealth, health sector privatisation and university tuition fees forming part of the (economic) left-right dimension and issues involving the future relationship with the EU, immigration, foreign aid and LGBT-inclusive sex education making up the (cultural) “closed versus open” dimension. Far more dramatically, however, we see that the positions of party supporters with respect to these dimensions have changed significantly.
Diagram 2 shows the mean positions of each party’s supporters in 2017.
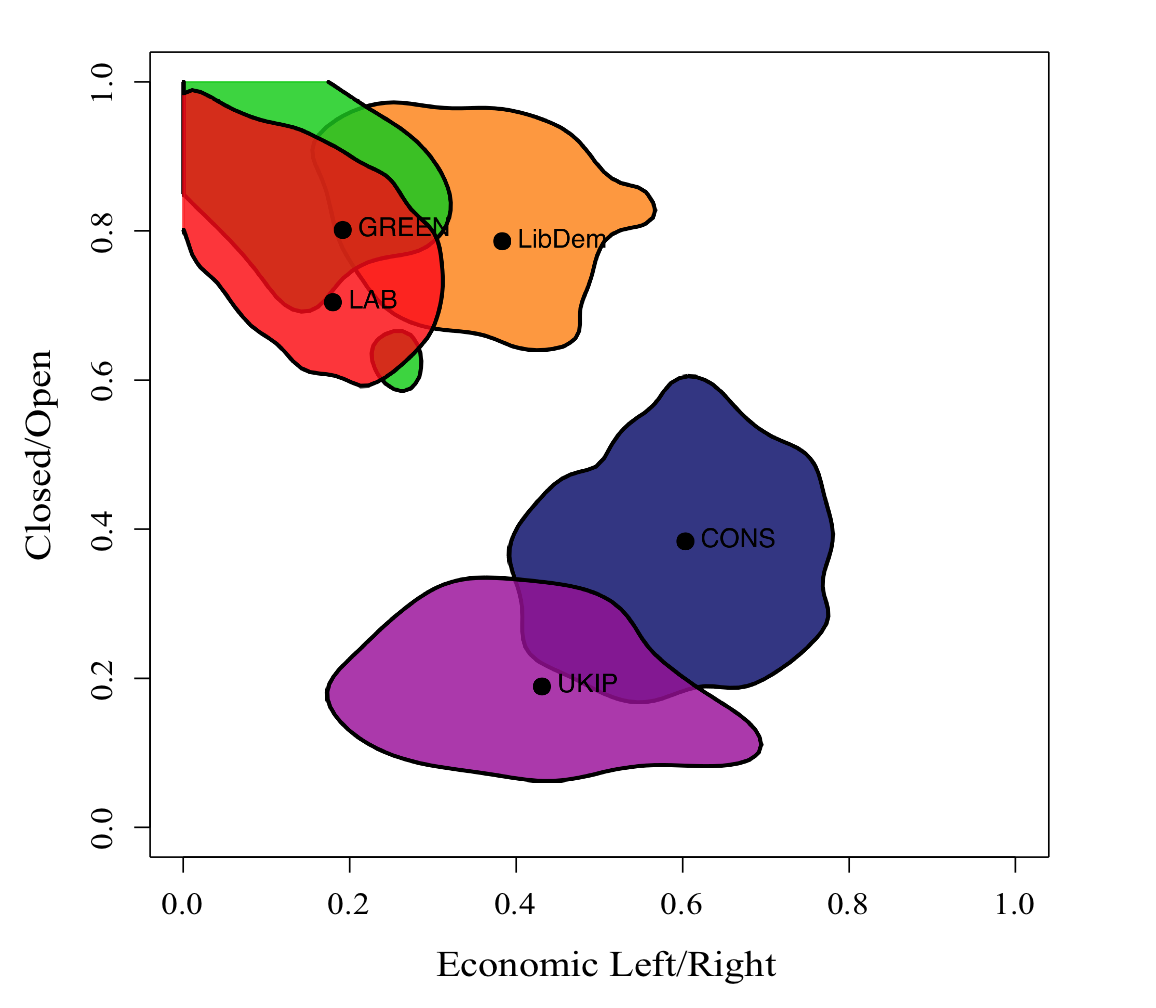
It is better not to focus on the actual positions of party supporters in the map as they depend on rather different opinion items compared with the 2015 version and are therefore measured in a different way. Looking instead at their relative positions, we see that party supporters have become far more polarised, especially with respect to the closed versus open dimension, but also to a certain extent with respect to the left-right dimension as well. Labour, Green and even Liberal Democrat supporters are concentrated near the “left-open” corner while Conservative and UKIP supporters are also joined in an embrace and are located towards the “closed” pole of the map. At the same time there is a wide gap in the middle that is not occupied by any party’s supporters. This, perhaps, reflects the legacy of last year’s referendum campaign, which may have led to a polarisation of preferences.
In reality, the middle is not empty and, given the recent volatility in the opinion polls, most likely contains large numbers of undecided voters. It is these that all parties, and especially the two main parties, will need to win over. For Labour, the dilemma is that they need to draw from two very distinctive support bases. On the one hand, there are the traditional Labour heartlands of the North and the Midlands, whose voters often take a “closed” position on the cultural dimension, and may have voted for Brexit or even toyed with UKIP in 2015. On the other are young cosmopolitan “open” voters, typically from London or the Home Counties, who may also consider the Lib Dems or the Greens. These two support bases seem to have moved further apart after last June’s referendum and are hard to accommodate in a single “tent”. From the evidence presented here and from opinion poll evidence, the latter group seem to have swung clearly behind Jeremy Corbyn’s Labour Party, while the former remain open to persuasion.
Both during the election campaign and previously, Theresa May has consciously attempted to target “closed” economic leftists. In terms of the cultural dimension, the famous comment in her speech at last year’s Conservative Party Conference that “if you believe you’re a citizen of the world, you’re a citizen of nowhere” represented a clear break from David Cameron’s more cosmopolitan outlook. Moreover, the Tories’ (at least superficially) economically leftist proposals during the election campaign to increase the living wage and statutory rights for family care and training, and to strengthen labour laws, represents a clear attempt at appealing to a more economically left-wing audience. However, it would seem that the appeal to this group has met with only partial success and has yet to be transformed into “hard” Conservative votes. While Jeremy Corbyn has been accused of aiming his appeal exclusively at already convinced leftists, by hyping up their focus on Brexit and adopting a more confrontational rhetoric towards European leaders, Theresa May’s Tories risk falling into the same trap of “preaching to the converted”.
It is sometimes said that elections are won from the centre ground. As former Shadow Secretary of State for Education Tristram Hunt pointed out in a recent article in New Statesman, perhaps this does not only apply to the centre in conventional left versus right terms, but also in terms of “open” versus “closed”.
______
Note: This article draws on material included in articles in British Politics and Policy and Internet.
Jonathan Wheatley is Lecturer in Comparative Politics at Oxford Brookes University.


It would be helpful to have a map of where a random sample of the UK Public falls on this matrix. If the public were evenly scattered across the matrix then only about half would have a set of political views that coincided with one or more of the parties. I suspect that the two clumps of parties are located at the two areas of the matrix where most people belong with perhaps a clump of “libertarians” in the top right, and a clump of egalitarian authoritarians in the bottom left..
Fascinating post.
The difficult is that the image is 2-d.
It would be more information if the ‘blog’s don’t usual vote, and look whether the 5% who occasional votes.
And also, which demonstrates the poles. However a 3d view would fascinating if to see the remain/leave at correlations.
How does this compare to party leaders and MPs positions?
Moot, I know, but it’s yet another argument in favour of mandatory voting.
If the disenfranchised centre don’t vote (“screw all the bastards”), then parties will continue to harden on the positions that motivate their base to come out and vote.
On the other hand, if everyone comes out to vote then the correct policy position tends to be a compromise between the core constituency and a middle ground that captures the majority of the middle.
Curious as to why Green and Ukip are so far apart given that here are policies that both hold that match exactly.
UKIP and the Green Party have some agreement on purely economic issues, but differ drastically on social issues. So while both sets of supporters might support a tax raise for the NHS, they would have substantially differing view on LGBT rights and immigration etc.
Curious as to why there is an outlying “island” of Green support in diagram 2?
Just a guess, but I feel the Green Party has some pretty diverse supporters. I imagine that the larger bubble is largely younger and relatively highly educated, whereas the smaller group might be made up of ‘homeopathy’ and almost NIMBY type supporters. Purely an unevinced guess.
Looking at the data, around three-quarters of those Green supporters in the main “bubble” said that they were voting Green because they agreed with the ideas of the party. However, if you look at those Green supporters who are located below the main “bubble” on the vertical axis, this figure drops to just below half. For this group another quite popular reason is simply that they don’t like the other parties. So yes, I think we’re talking about somewhat different types of Green supporters.