 Most arguments about electoral reform are thinly veiled cloaks for partisan self-interest. By contrast Patrick Dunleavy argues that, whatever your party, there is now an overwhelming public interest case for adopting the Alternative Vote – to restore to all MPs genuine majority support in their locality. This is the crucial first step in restoring the tattered legitimacy of Parliament. Not adopting this reform would condemn MPs to ever-worsening status in the eyes of their local communities in the future.
From one election to the next, two thirds of MPs no longer have the support of a majority of voters in their constituency. The forthcoming referendum on introducing the Alternative Vote may be a compromise by-product of the Conservative and Liberal Democrat coalition agreement. But it provides an opportunity for everyone, regardless of their party or views on proportional representation, to recognize the case for a minimum change of voting system, to at least restore local majority support to all MPs. That could be a crucial basis upon which, slowly at first, MPs could begin to rebuild some of the legitimacy of Parliament that has been so dramatically shredded in recent decades, by careless legislation, broken election promises, and the expenses scandal of 2009.
How have MPs so extensively lost local majority support without themselves or most media commentators really noticing it? The change has happened gradually, election by election since the 1960s, as the number of parties contesting seats in the UK has gradually increased and voters have shifted to back them. Today we have a six or seven party system in every region of the UK, with third party (Liberal Democrat) ministers in government for the first time since 1945, and many parties now scoring salient vote shares at different elections. In both 2009 and 2004 parties to the right of the Conservatives (namely UKIP and the BNP, both with MEPs and London Assembly members) gained just under a quarter of all votes nationwide in European Parliament elections. The Greens have their first MP in Westminster to add to their MEPs and London Assembly members. This is a trend that has been operating for many decades and that is not now going to retreat or mysteriously go away. British voters want to vote for more parties and more viewpoints than before.
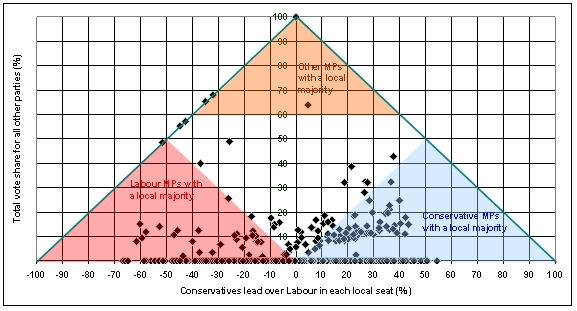
If we go back before this trend happened to the 1955 general election, a low point for Liberal support and the heyday of the two-party Conservative-Labour system, the vast majority of MPs drew on majority support in their constituency, as the chart below shows. Here each black blob is a single constituency outcome. The bottom axis shows the Conservative vote share minus the Labour vote share. So the further from the centre a constituency is to the right, the greater the Tory lead. And the more a constituency is on the left of the centre-line, the more solidly Labour it is.
The constituency outcomes in the 1955 general election, in Great Britain

The vertical axis here shows the combined share of votes going to all other parties, in 1955 pretty much only the Liberals and a few independents. Taken with the horizontal axis, this means that all feasible outcomes must lie inside the overall double-triangle shape outlined in the green borders here. There cannot be any outcomes outside this overall area.
In 1955, in the vast majority of constituencies there were no other candidates except the Conservatives and Labour. Hence in all those hundreds and hundreds of seats the outcome lies on the bottom axis itself – where seats after seat lies piled on top of each other, so many that the chart cannot possibly show them all. In the 110 seat that the Liberals still contended, and a few others, the ‘third party’ vote held up, and these are the scatter of blobs above the bottom axis, mostly concentrated in Conservative areas.
The shaded triangles inside the overall feasible space above allow us to see that the vast majority of MPs could draw on majority support in their constituencies in 1955. Every black blob in the blue-shaded area is a Tory MP with majority backing, and similarly Labour MPs with majority support fall inside the pink-shaded triangle. (There are just a handful of seats won with majority support by the Liberals). The constituencies where MPs lacked majority support are the black blobs on a white background – there are only a few tens of constituencies, out of 650 seats in all. In other words for an MP not to have a local majority was a rare exception.
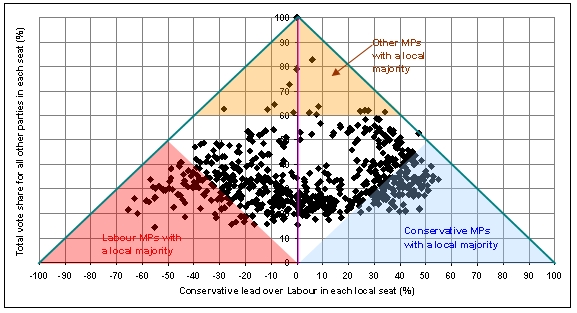
Flip forward to 2010 shown in my second chart below and a huge difference is apparent. Two-party contests have completely disappeared, and support for parties other than the Conservatives and Labour is rarely less than a fifth of total votes, occurring in only a few handfuls of seats. As a result the whole set of black blobs showing constituency outcomes has shifted radically upwards. Across the whole bottom third of the feasible area there are only a scattering of seats with total ‘other party’ votes below 20 per cent. The core band of seats has moved up the chart, but still shows a marked Conservative versus Labour patterning – yet with much higher levels of voting for third, fourth and subsequent parties. Above all the advent of the coalition government reflects the number of seats where the Liberal Democrats, SNP, Plaid Cymru and other parties now regularly win around 90 constituencies out of the 628 in Great Britain, shown mainly by the ‘curling over’ of seats on the sides of the distribution and extending in an upper swathe across the middle of the diagram. Where the total other party vote is above 33 per cent, many seats are still won by the Conservatives or Labour, because remember that the ‘other’ vote is split across several different parties. But the higher up blobs occur on the chart, the less likely they are to be held by one of the top two parties.
The constituency outcomes in the 2010 general election, in Great Britain

The 2010 chart clearly shows how few MPs now win local majority support in the vast majority of seats appearing as black blobs on a white background. Because the Conservatives did relatively well in 2010 they have rather more MPs with majority backing than Labour (who did badly). But looking back at the 2005 election would show an almost reversed distribution of majority MPs. It is completely clear that only the fringes of either major party’s seats now fall into the shaded triangles showing majority support, whereas in 1955 almost all did so. (The seats where ‘other’ parties win also tend to be the most multi-party ones, so there has been little compensating growth of MPs from third or fourth parties with majority support).
My final chart below shows in parts (a), (b) and (c) a simplified picture of that development that has brought us to where we are today. The trend for more British voters to support parties other than the Conservatives or Labour has not been absolutely continuous over time, but it has been ineluctable, long-lived and in one direction for a long time now. There is no reason whatever to suppose that the pattern of change across the 1955 and 2010 charts above is somehow going to reverse. Hence unless we change the voting system to acknowledge it we will perforce have to live with a situation where fewer and fewer MPs have majority backing amongst voters in their local areas.
The past evolution and predicted future development of the British party system

You also do not need to be a far-sighted prophet to predict the long-run endpoint of the UK political systems’ evolution, shown in part (d) above. The UK is increasingly becoming a standard European liberal democracy with a full range of parties, running from the Greens on the left to well-supported anti-foreigner parties on the right. The end point of this development will essentially be a multi-party competition situation where virtually no MPs have majority support.
The Alternative Vote (AV) system to be offered to the electorate in the May 2011 referendum is a controversial system in some respects. It is not perfect, but then no voting system is. There are two or three different ways in which it might be implemented, including the ‘classic’ Australian version and the simplified London version successfully used in the capital’s mayoral elections. Any version of AV allows voters to use their first preference vote support the parties they most favour, but also to use their second preference vote to decide between the top two candidates in their constituency and to back the one they prefer.
Supporting a change to AV should be the clear decision of anyone concerned with the badly damaged status of Parliament in recent years, and of anyone who wants to rebuild the status and local legitimacy of MPs. Opposing this reform is to choose a course of action with no hope of improvement. Backing it will restore to our local representatives the unchallenged legitimacy as the authentic voice of majority opinion in each area of the country. This is the completely non-partisan and completely public interested case for voting for a long overdue change.
The Political and Constitutional Reform Committee at the House of Commons, chaired by Graham Allen MP, has issued a call for people to submit evidence on the government’s proposal for voting reform and parliamentary reform. See:


Hi Patrick,
Other than observing the trend over the past 50 years (and expecting it to continue), what other evidence would you cite to support your forecast?
Is this forecast a consensus among UK political theorists?
Many thanks,
Max
Thanks for your comment Philip. There’s actually no mistake in the diagram but I can see that it is not completely clear why the top triangle ends at 60 per cent.
The vertical axis measures the total vote for all parties except Labour and the Conservatives, and not the vote for any single third or subsequent party. Hence there is in fact no single determinate line at which a seat can be won with a majority (50%+1) by a third party – it will depend a lot on local circumstance. Of course, there are many seats won by the Liberal Democrats or SNP and Plaid Cymru. But they generally do not win local majorities in these seats, because there is usually at least 10 per cent of the vote for other parties besides the big two in England, such as UKIP, the Greens and the BNP. And there are much higher levels of smaller party votes in Scotland and Wales. Because of this effect, ending the top shaded triangle at 60 per cent is an approximation only. It provides a reasonable indication that it is only seats above this line that could conceivably be won with local majority by a party other than the Conservatives and Labour.
There’s a mistake on your charts, the triangle at the top should go down to the 50% line, not the 60% line as it does at present.
Otherwise, I agree with you.
I am happy to see electoral reform supported in the publications of the LSE.
Electoral reform must be supported, and the Alternative Vote will make politics more competitive and do a better job of recording voter preferences.
I will continue to demand proportional representation, and so should we all.