 In recent months, many have pointed to the role of spatial segregation as a major factor in restricting the life chances of black citizens. Using a dataset of 5.7 million geotagged tweets from Louisville, Kentucky, Taylor Shelton investigates how the spatial inequalities that stem from this segregation play out in practice, finding that people from different sections of the city use the urban landscape in very different ways.
As one city after another erupts in protests over the repeated killing of black citizens at the hands of police, scholars have been quick to point out the origins of this violence and subsequent protests in longstanding public policies meant to ensure that American society is fundamentally different for whites and blacks. Of particular importance has been the role of spatial segregation as a way of restricting where black citizens could live – and ultimately, accumulate wealth – through a variety of tactics employed and sponsored by both government institutions and the private sector.
But as I argue (along with Ate Poorthuis and Matthew Zook) in recent research, new forms of digital data drawn from social media platforms offer us the opportunity to rethink how these social and spatial inequalities play out in people’s everyday lives. In turn, we can also use this data to develop alternatives to more conventional narratives about how these inequalities are reflected in the urban landscape. For instance, in cities across the US, one of the most prevalent ways of thinking about racial and class segregation is that of a ‘divide’ between two seemingly separate parts of the city, one often more affluent and white, the other dominated by poor and minority populations. But by seeing these parts of the city as fundamentally separate and apart from one another, rather than as two sides of the same coin, this way of thinking often has the effect of blaming the victim for the problems inflicted on them from the outside.
In Louisville, Kentucky, the division between the long-marginalized West End and the rest of the city is almost subconsciously engrained in the mental maps of residents:
“Any Louisvillian who has lived here for more than a few years knows, almost instinctively, the boundary line between west Louisville and the rest of Louisville: Ninth Street. Most white Louisvillians know it because they’ve heard some variation of the warning, ‘Don’t go west of Ninth Street.’…Although the notion that west Louisville is a dangerous and even foreign place is embedded in the mental map that many of us – even the most bleeding-heartedly liberal and racially tolerant, if we will admit it – carry around in our heads, it is rarely talked about in public”
But despite the ability of this metaphor to draw attention to these persistent inequalities, it belies both the complexity of how these inequalities are manifest in the everyday activities and mobilities of Louisvillians and the fundamental interconnection between social problems and processes occurring within the West End and those occurring beyond it. By collecting roughly 5.7 million geotagged tweets in the city of Louisville over the course of a two-year period, we are able to go beyond conventional studies of informational inequality – which might simply note that West End neighborhoods have only about 40 percent as many tweets as a comparable area of the city’s East End – by understanding the context of these geographies and how people from different parts of the city utilize the city in different ways.
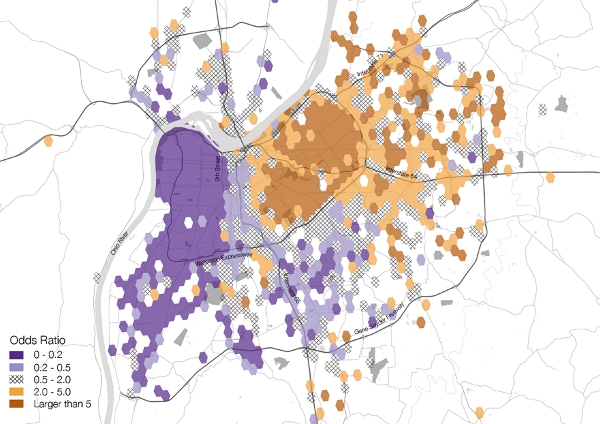
Figure 1 – Unevenly segregated activity spaces of West End and East End residents

By identifying those users within our dataset that ‘belong’ to either the West End of the East End based on persistent patterns of tweeting from either place, we’re able to compare how the individuals within these different groups move through and utilize the city over time. In Figure 1 above, the odds-ratio measure shows the relative dominance of one group over the other, such that a value of 1 represents equivalent amounts of tweeting between the two groups, values less than 1 signifying a dominance of West End users and vice versa for values greater than 1. Perhaps unsurprisingly, the areas we used to define the West End and East End for data collection purposes show a general dominance of users from those areas, and Ninth Street is clearly visible as the point at which a significant dominance of West End users gives way to greater levels of heterogeneity in the downtown area. But what our analysis shows most directly is that it’s actually those East End users who are more spatially segregated within the city.
So while West End users are fairly mobile within Metro Louisville due to the necessity of traveling for work, school or entertainment purposes, the predominantly white and affluent residents of the East End exhibit substantially constrained mobility in that there are many parts of the city, especially the West End, to which they do not travel. After accounting for so-called ‘power users’ who might skew our data, 45 percent of tweets from West End users were to the east of Ninth Street, while only 7 percent of tweets from East End users were west of Ninth Street. This contrast is all the more stark when accounting for the fact that most of the South End neighborhoods, which demonstrate the most significant connection with the West End, are also west of the Ninth Street boundary. What this map further demonstrates is that for all of the concentrations of tweeting activity in areas of the downtown, East End or other locales, a significant portion of this content is actually being created by users from the West End who travel across the city to these locations on a regular basis.
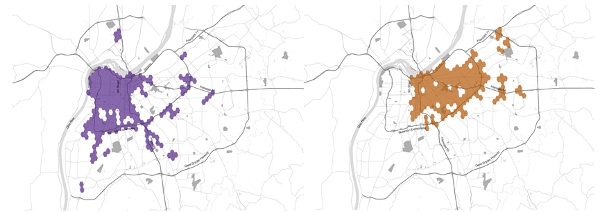
Building on this analysis, we sought to redraw the boundaries of these neighborhoods based on significant concentrations of tweeting by each user group, in order to highlight the fluidity of these borders and the interconnectedness of these areas. The boundaries depicted in Figure 2 below show those areas of the city where each user group contributed a total of at least fifty tweets by at least ten different users. Though the West End and East End remain spatially distant enclaves in some respects, they also overlap at key points, such as public spaces in the downtown and waterfront area, as well as suburban shopping malls that serve as key focal points for social activity as reflected through social media.
Figure 2 – Redefining the boundaries of the West End and the East End

Though our redefined East End boundary represents only a subtle change, it is evident that when East End users do move beyond the conventional boundary, they tend to gravitate only further eastwards towards further-flung suburban and upscale commercial areas. That being said, our redefined East End also encompasses much of the city’s downtown area as well as some traditionally working-class white neighborhoods, suggestive of recent urban redevelopment seeking to draw people back to the city’s urban core. The only point at which our expansive East End boundary approaches the conventionally defined West End is in the areas surrounding the Churchill Downs racetrack and the University of Louisville.
The redrawing of the West End is, however, much more significant in scope. While the census tract definition is bounded by 9th Street to the east, Algonquin Parkway to the south, and the Ohio River to the north and west, the everyday mobilities of West End Twitter users extend throughout the city. From the entire downtown area and the University of Louisville campus, to major transportation and commercial corridors throughout the East End, our redefinition of the West End demonstrates the incredibly partial story told through tropes of the West End as being somehow isolated and apart from the rest of the city.
Though this data can provide only a partial understanding of why people move through the city the way they do, it can still be extremely useful for understanding how social and spatial inequalities manifest themselves in practice. Perhaps more importantly, combining this data with a sensitivity to the complexities of these places and the way we imagine them allows for a counterpoint to more dominant discourses around the Ninth Street Divide – not to mention similar divides in other American cities – that serve to isolate and pathologize the West End and its residents, reinforcing the harmful policies of social and spatial segregation that led us here in the first place.
This article is based on the paper ‘Social media and the city: Rethinking urban socio-spatial inequality using user-generated geographic information’, in Landscape and Urban Planning.
Featured image credit: Jason Howie (Flickr, CC BY)
Please read our comments policy before commenting.
Note: This article gives the views of the author, and not the position of USApp– American Politics and Policy, nor of the London School of Economics.
Shortened URL for this post: http://bit.ly/1d3k3bu
_________________________________
 Taylor Shelton – Clark University
Taylor Shelton is currently a PhD candidate in the Graduate School of Geography at Clark University in Worcester, Massachusetts, working on his dissertation from afar while living and working in Lexington, Kentucky. He is a broadly-trained human geographer with interests in geographic thought and methodology, especially around the use of geotagged social media data for geographical research, and the broader implications of these new forms of data for the ways we understand and intervene in the world around us.


4 Comments