

 In this post, Chris Hanretty, Ben Lauderdale and Nick Vivyan investigate the predictive performance of the betting markets relative to their electionforecast.co.uk forecasting model.
The failure of the opinion polls to accurately estimate national vote share has led some to suggest (here, here) that we should instead look to betting markets as a way of eliciting information about election outcomes.
National betting markets performed better than national poll-based forecasts: although they implied that the most likely outcome was a hung parliament in which the Conservatives were the largest party, they implied a relatively high probability of a Conservative majority, which our model viewed as incredibly unlikely. However, it is hard to argue for either the superiority of betting-market-based or poll-based forecasts on the basis of a single electoral contest, and it is worth noting that betting markets in 2010 also implied a Conservative majority was more likely than not very possible .[1]
In this note, we investigate the accuracy of implied probabilities of constituency outcomes rather than implied probabilities of national outcomes. Constituency markets provide multiple (correlated) tests of accuracy, and allow us to draw firmer conclusions about the relative accuracy of poll- and market-based estimates.[2]
The odds available on outright-winner betting markets can be turned into probabilities of different events occurring (Wolfers and Zitzewitz 2006). Intuitively, as the odds rise above (fall below) the true probability of victory, well-informed bettors move in to back (lay) alternative candidates. Where (liquid) markets exist for a large number of contests, betting markets can in theory provide detailed information about election outcomes.
The purpose of this note is to test whether betting markets actually provided a more accurate guide to constituency-level outcomes than did the electionforecast.co.uk model, which was primarily based on opinion polls. Our forecasting model generated predicted probabilities of victory for each party in each seat. As such, these can be compared to the probabilities implied by constituency betting markets, which offered prices on each candidate in each mainland GB constituency.[3]
The betting data
Our data on betting market prices on Betfair were downloaded from http://www.firstpastthepost.net/data/. The prices are taken from the last update at 5am on Thursday 7th May.
The price information was turned into implied probabilities by taking the reciprocal of the price, and dividing the implied probabilities across candidates by their sum, such that probabilities in each constituency market sum to one.
The forecast data
The forecast probabilities of victory for each candidate were taken from the electionforecast.co.uk update made public at 12 midnight on the 6th May. This was our penultimate forecast. This date was chosen to match as closely as possible the date of the betting data. Thus, although we posted a final forecast at 1pm on the Thursday of the election, we have chosen to take our forecast from the night before.
Outright winner
The most obvious and simplest check on the relative accuracy of betting markets and poll-based forecasts is to ask whether each method correctly predicted the winner in each seat. That is, did the candidate with the highest predicted probability win?
There are four seats where the market data gives a tie between two parties, for each of these we give half a correctly predicted seat if one of these two matches the correct seat outcome. We find that
- constituency betting markets correctly predicted 570 of 632 winning candidates, or 90.2%.
- our poll-based model correctly predicted 570 of 632 winning candidates, or 90.2%.
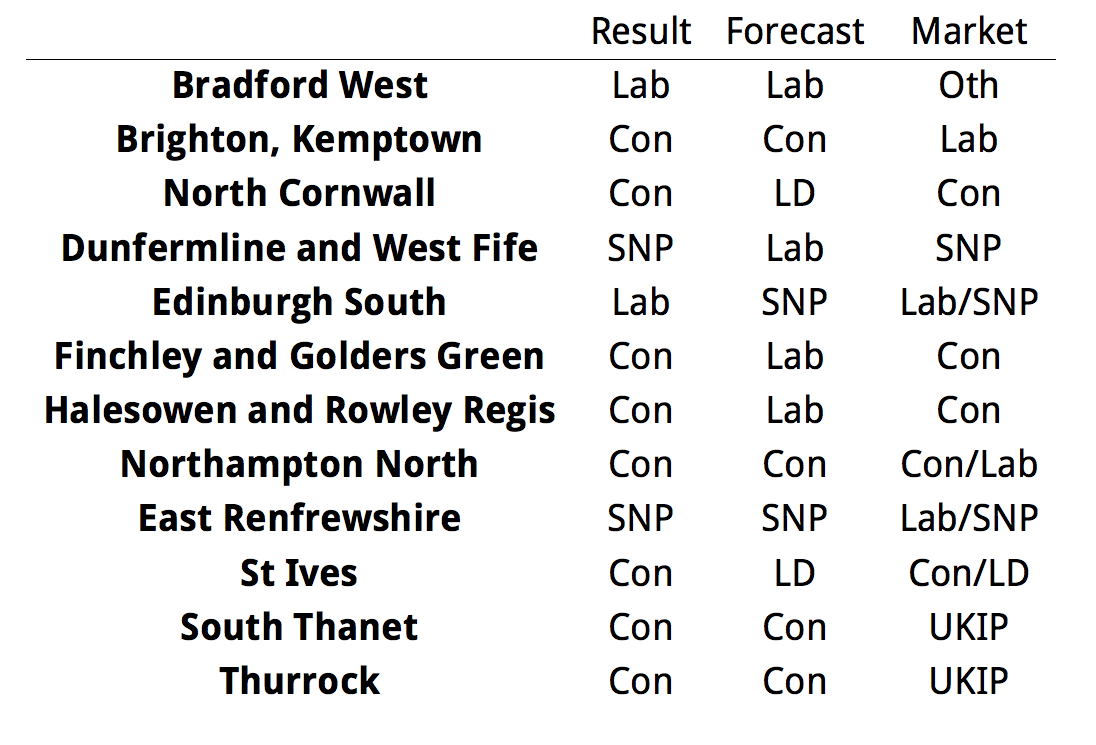
Thus, on this relatively simple test, there is no difference in predictive performance. There is also nearly perfect agreement of the forecast and the betting market. The most probable winner only differed in 12 out of 632 seats if we include the split market predictions as disagreements. Of these our forecast had the correct prediction in 6, the market had the correct prediction in 4, and a half-correct prediction in 4:
Comparison by Brier scores
The percentage of seats correctly predicted is an easy-to-understand diagnostic, but it can be misleading. It may be that the betting markets were much more confident about the winning candidate in each seat, whereas our polling-based model was less confident, and assigned a lower probability of victory.
Brier scores are one way of assessing the accuracy of a set of probabilistic forecasts. The Brier score penalizes confident mispredictions and rewards confident successes. Brier scores range between zero and one; and lower Brier scores are better.
When we calculate the Brier scores for the implied probabilities for the betting markets, and for the probabilities from the poll-based model, we find
- constituency betting markets had a Brier score of 0.145.
- our poll-based model had a Brier score of 0.151.
These scores are a sort of error rate in seat prediction, adjusted for the strength of the predictions. Thus if we multiply them by the number of seats, we get an adjusted seat error totals of:
- constituency betting markets had a Brier seat error of 91.5 seats.
- our poll-based model had a Brier seat error of 95.5 seats.
Thus, when we account for the probabilistic nature of the forecasts and implied probabilities respectively, we find that betting markets do slightly better than our poll-based model.
De-biasing market-implied probabilities
Implied probabilities derived from betting market prices are known to be poorly calibrated. In particular, they over-estimate the probability that long-shots will win, and correspondingly under-estimate the probability that favourites will win. In our poll-based models, we allowed for the possibility that polls might be biased, insofar as they exaggerated change since the last election. It is therefore only fair to allow a correction for the favourite/longshot bias in betting markets.
In order to estimate the magnitude of the favourite-longshot bias in constituency betting, we use data collected by Wall, Sudulich, and Cunningham (2012) for the 2010 general election. We run a zero-intercept logistic regression model using the outcome in each seat (candidate did or did not win) as the dependent variable, and the market-implied probability of victory as the independent variable. We can use the coefficient on the market implied probability to correct the implied probabilities for 2015.[4]
Specifically, we define the debiased probabilities (p*) using the market-implied probabilities (p) as follows:
In practice, this makes small probabilities smaller, and large probabilities larger. A probability of 0.01, or 1-in-100, becomes a probability of 0.0002, or 1-in-5000.
With these “debiased” estimates, we can recalculate the Brier scores for the polling-based model probabilities and the debiased betting market probabilities. We find:
- debiased constituency betting markets had a Brier score of 0.139.
- this compares to our poll-based model which had a Brier score of 0.151.
As before, we can transform this to an expected seats error:
- constituency betting markets had a Brier seat error of 87.7 seats
- this compares our poll-based model Brier seat error of 95.5 seats.
Thus, when debiasing market-implied probabilities, we find that betting markets do better than a poll-based model, when based on Brier scores. The differences are still not very large.
Visualising Probabilities of Victory
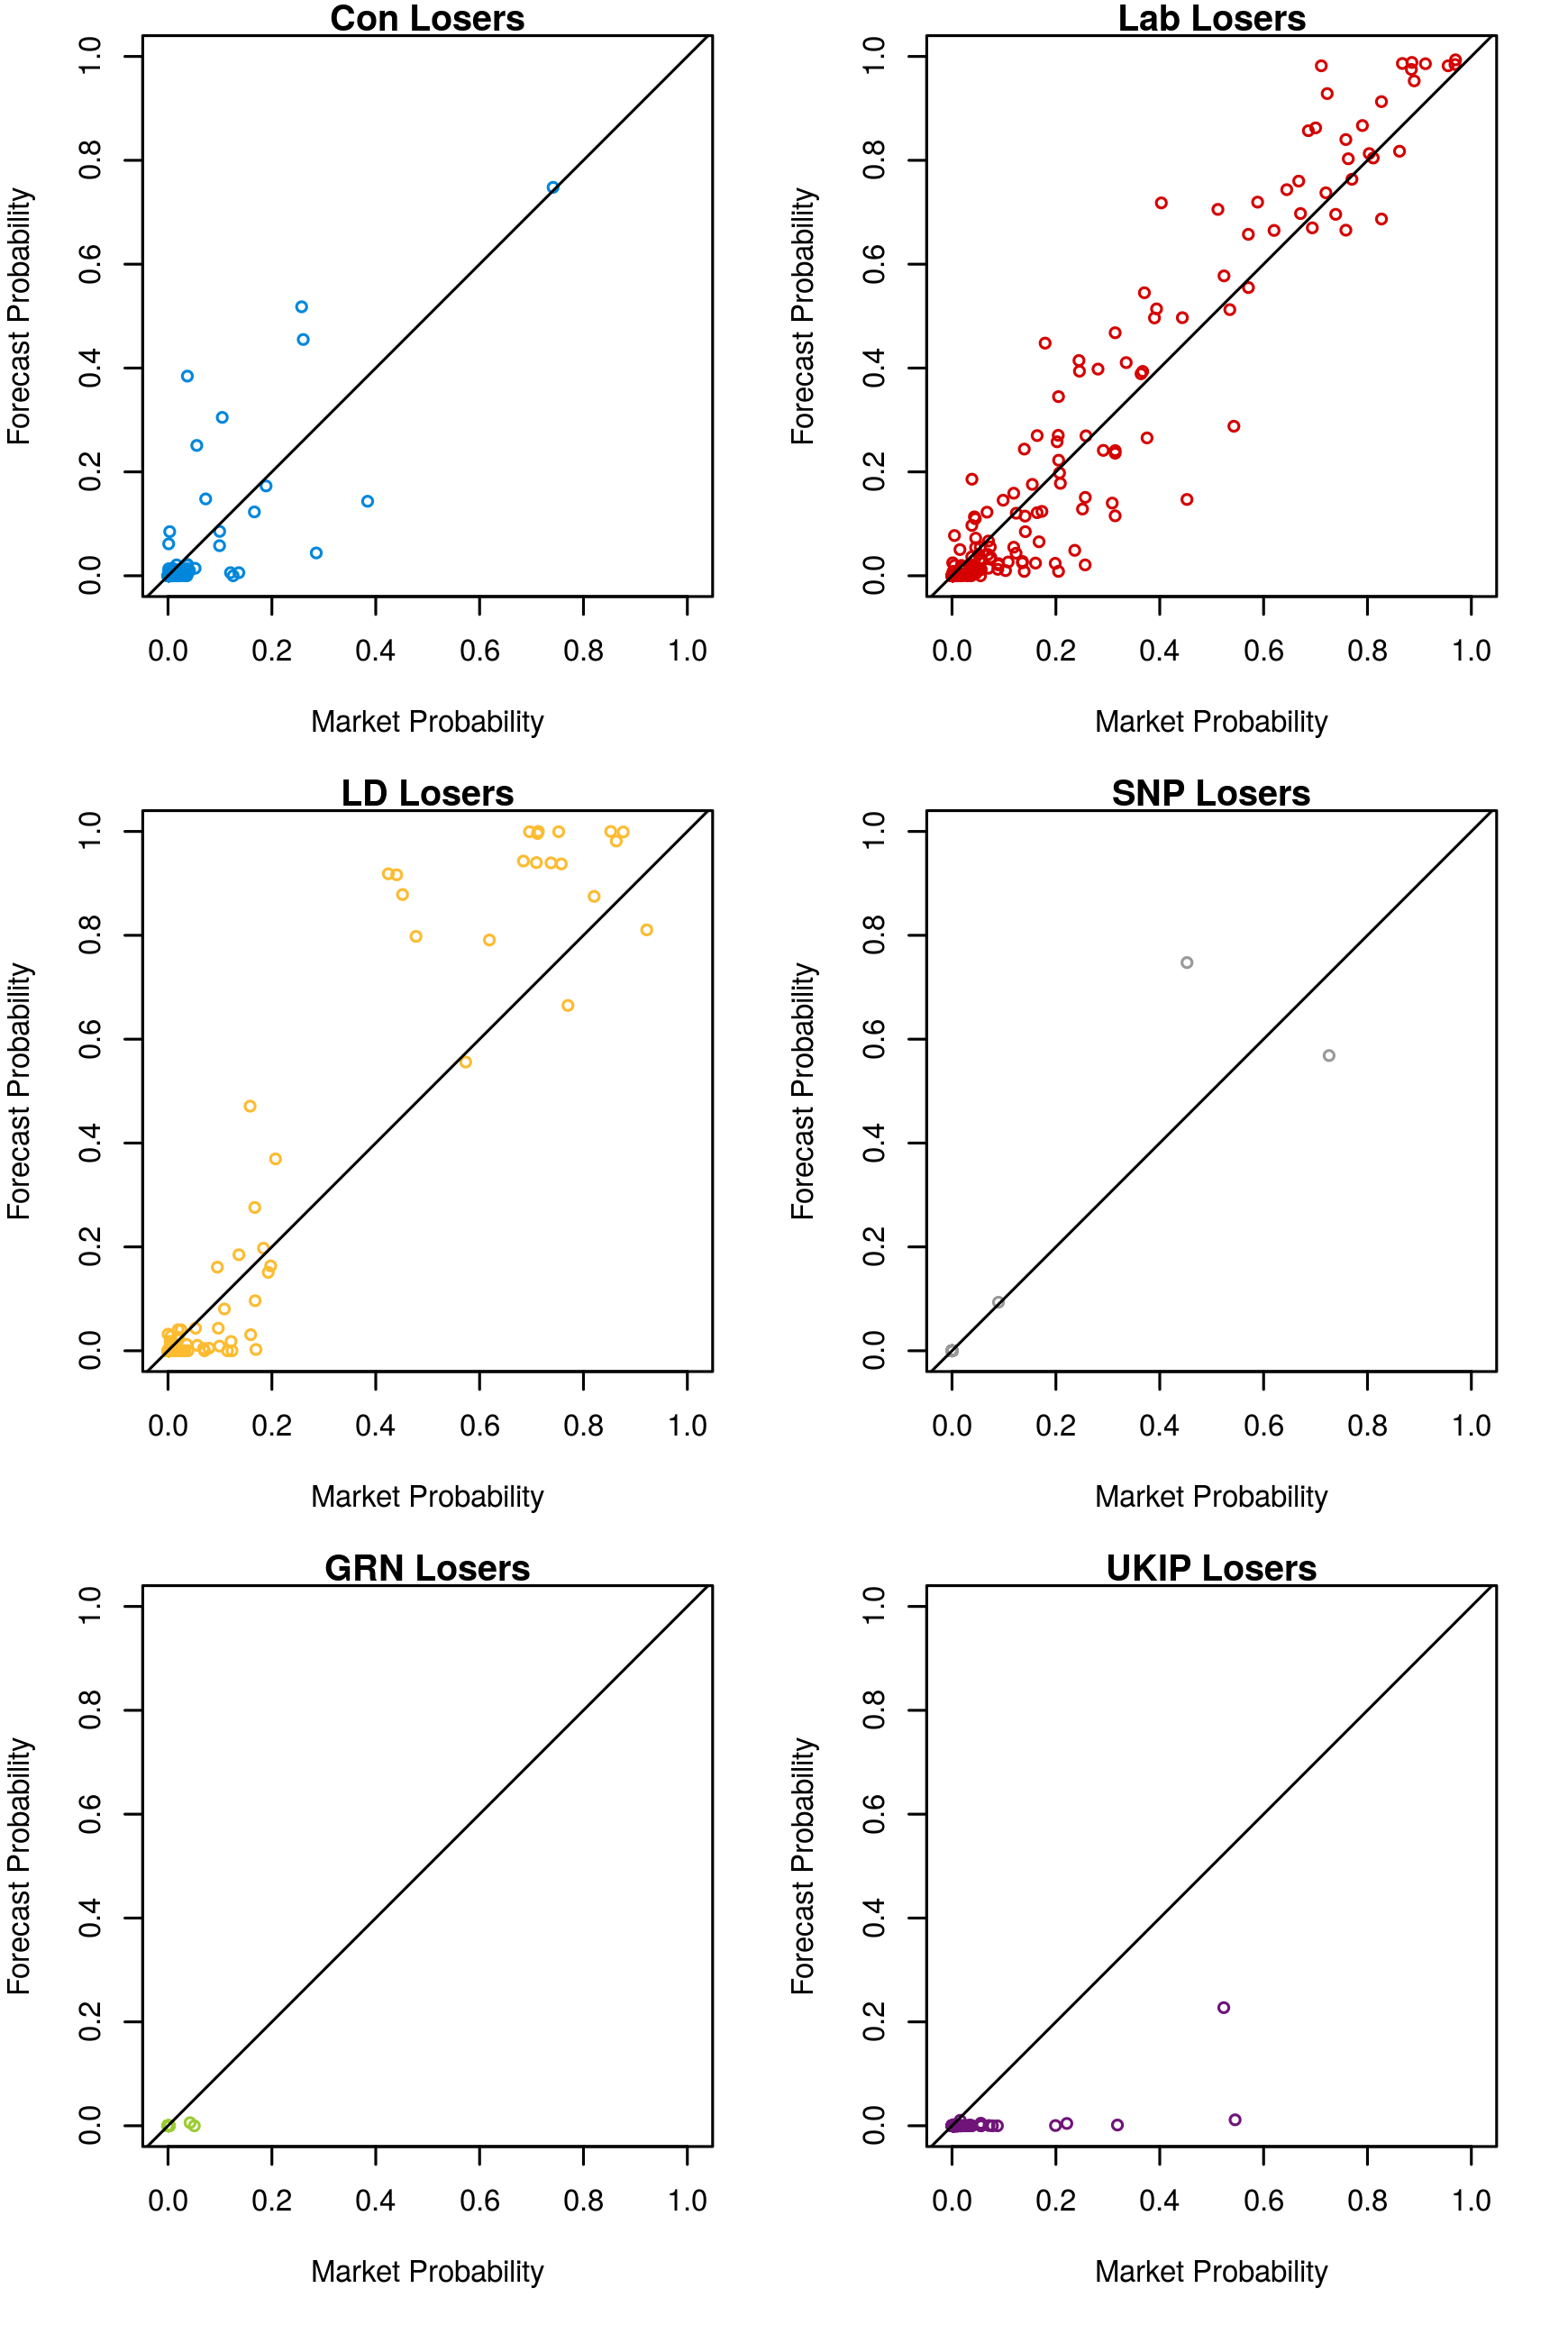
The market-implied probabilities outperformed our forecast probabilities primarily because our model was over-confident in its predictions. In general, our model was more decisive than the markets for most seats. Since most seat predictions were correct for both the forecast and the market, this meant that in in 546 seats the model made a better prediction according the Brier scoring function, however the large penalties from errant and highly confident predictions in the remaining 86 seats have higher weight in the scoring function. This can be seen in Figures 1 (plotting candidates who won) and 2 (plotting candidates who lost).
Note that these market-implied probabilities are the debiased probabilities discussed above. We are even more over-confident compared to the original odds. This is probably because the original odds are under-confident because of the favourite-longshot bias.
Figure 2: Forecast versus market probabilities, winning candidates
Figure 2: Forecast versus market probabilities, losing candidates
Conclusion
We have shown that while our final forecasts and the betting markets on the morning of the election did equally well in terms of individual seat predictions, the betting market probabilities were slightly better calibrated as predictors of probability of victory in individual constituencies.
We initially carried out this analysis on the basis of betting market data from the morning of the 5th May and our forecasts from the same day. In that analysis, we found our forecast did slightly better by Brier score than did the betting markets, so we do not think the differences we are observing are especially robust.
Part of the reason that we see very little difference in predictive performance is that there was very little difference between our poll-based forecasts and what the betting markets showed. There are several possible explanations for this. First, our forecasts did not include market data, but the markets could respond to our forecasts. So to the extent to which market participants found our forecast credible, they would have incorporated the information from our model into their betting decisions. Second, both we and the market participants had access to the same polling data, and may have come to similar conclusions in the aggregate despite different methods of analysis.
Consequently – and bearing in mind the poorer performance of the betting markets in 2010 and the systematic failure of the polling industry in 2015 – it would be premature to declare that either method of deriving probabilities of election outcomes is clearly superior to the other.
Notes
Figures accurate as of May 15th, 2015.
[1] The Conservative seat spread on the day of the election was 317-322 with Sporting Index. See http://www2.politicalbetting.com/index.php/archives/2010/05/06/the-opening-markets/
[2] Some have argued that since national markets are more liquid, they are more accurate than constituency markets. If this were true, we would be engaging in an unfair comparison. But previous research examining constituency markets has found no relationship between liquidity and accuracy (Wall, Sudulich, and Cunningham 2012), and so it is not clear to us that the comparison between poll-based forecasts and constituency markets is more unfair than the comparison between poll-based forecasts and more liquid national markets.
[3] This is not strictly equal to a test of “markets versus polls”, for our model incorporated additional elements beyond polls in order to interpolate results for constituencies not polled and to model certain systemic biases in national polling. See this 538 article for a full description of our methodology.
[4] We note that applying this same correction to the markets for national outcomes shrinks the implied probability of a majority government, bringing the betting markets closer in line with academic forecasts.
References
Wall, Matthew, Maria Laura Sudulich, and Kevin Cunningham. 2012. “What Are the Odds? Using Constituency-Level Betting Markets to Forecast Seat Shares in the 2010 UK General Elections.” Journal of Elections, Public Opinion & Parties 22(1): 3–26.
Wolfers, Justin, and Eric Zitzewitz. 2006. Interpreting Prediction Market Prices as Probabilities. National Bureau of Economic Research.
 Chris Hanretty is a Reader in Politics at the University of East Anglia.
 Benjamin Lauderdale is an Associate Professor in Methodology at the London School of Economics.
 Nick Vivyan is a Lecturer in Quantitative Social Research at the Durham University.






As Sporting Index are referenced here it may be worth reading my (Sporting Politics Trader) take on the situation:
http://www2.politicalbetting.com/index.php/archives/2015/05/18/as-the-post-ge15-polling-debate-continues-spins-aidan-nutbrown-asks-are-elections-random/
The situation is far more complex than many think and yet in that complexity lies fundamental beauty.
I have conducted a similar exercise for my blog, but compared total GB seat predictions from electionforecast.co.uk and other academic forecasts (electionsetc.com and Polling Observatory) with the equivalent from Sporting Index, the most liquid spread betting market. See http://alberttapper.blogspot.co.uk/2015/05/predicting-ge-2015-which-group-should_7.html
On this comparison too, there was little difference in predictions between the academic forecasts and the betting market, although the betting markets were slightly less wrong. I concluded, like the article above, that this was unsurprising given that both predictions were largely driven by the same opinion poll data. The betting markets had the advantage of being able to discount the information from the pollsters, in-running, and they did as polling day drew near. (By contrast, the academic models made no changes to their reliance on the polls).
Looking at the markets on SNP seats and whether there would be a hung parliament, I found clear evidence that the betting public were much slower to respond to polling information than the academics, perhaps because these markets are more technical / less well understood for the non-expert. Getting long (i.e. going high) of SNP seats in December / January when the market stood in the low twenties, was the big opportunity to make serious cash during the election given that the other seat markets (bar Ukip) were so static, but there was no evidence of a public gamble. I understand that Sporting Index remained long of SNP seats throughout, which is an indictment of the punters and a credit to the Sporting Index traders. The academics got that right too, but misled with the degree of certainty they ascribed to the chances of a hung parliament, but can reasonably blame the polls. Credit to the Scotsman who ignored the polling and the academics and staked £30k in cash on a Tory Overall Majority at a central Glasgow Ladbrokes shop – ten days before the vote.
As you point out in the conclusion, betting markets are just responses to polling data so it isn’t particualrly surprising that they are similar. An actual comparison would pitch betting markets in the absence of polling information against polls.
Of course that would be difficult although there may be some countries without sophisticated polling but advanced betting markets.