 With less than one week to go until polling day, and irrespective of the fact that the polls are extremely close (they are), we should focus on whether the electoral system helps one or other of the two largest parties, argues Tom Lubbock. In recent years the system has had a skew to Labour resulting from its biases. Will it this time around?
Unlike so many of the outstanding questions about this intriguing election it is possible to give an answer to the electoral skew question before in-person voting begins on May 7th. By taking a forecast of the election result and running it through some simple equations it is possible to give a rough and ready verdict on who is going to benefit from the electoral system. I’ll present the results of this analysis and then move further into the weeds to explain what is going on and how it was carried out.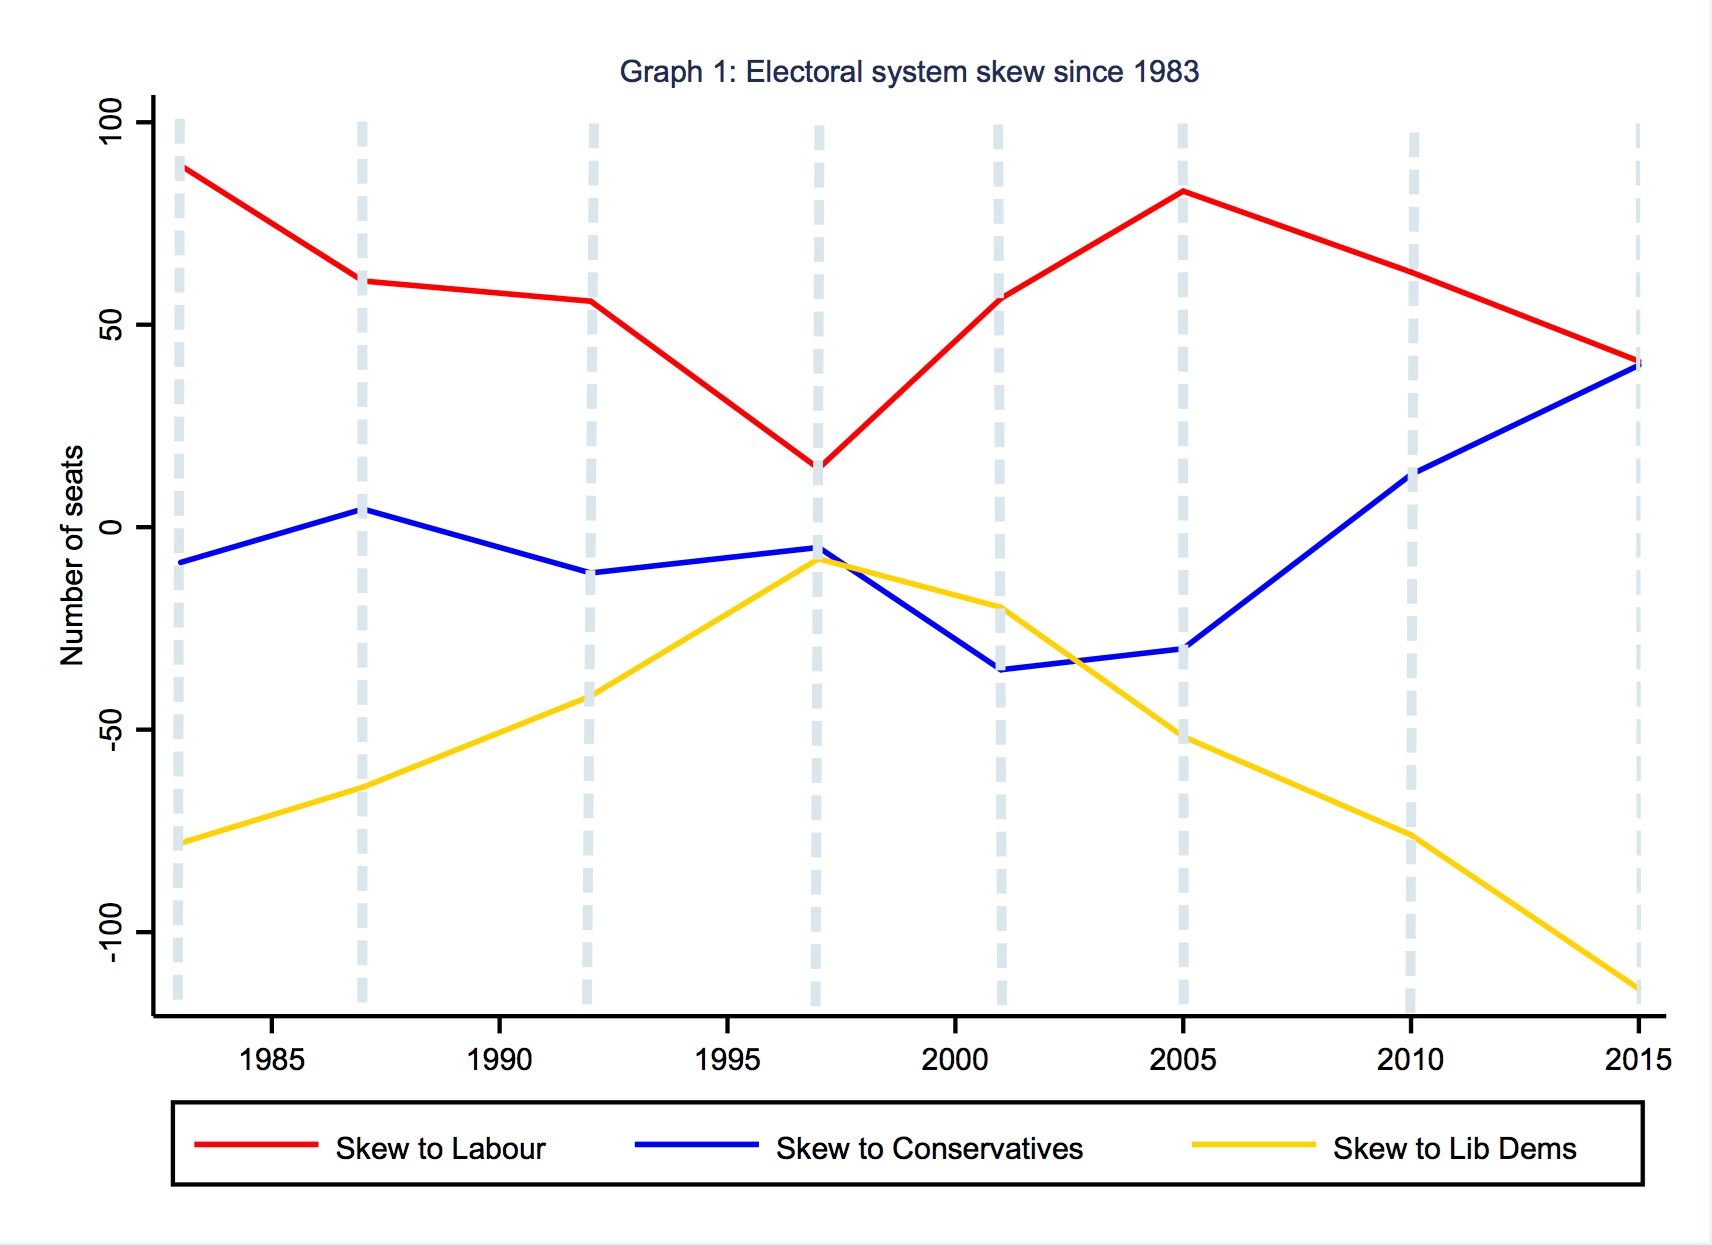
Graph 1 illustrates the skew from previous elections since 1983, and the finding that on the basis of the best forecast of the 2015 election Labour and Conservatives are almost exactly equal beneficiaries of the electoral system in 2015. Labour benefit to the tune of 41 seats and the Conservatives benefit from a 40 seat skew. As you can see from Graph 1 the last time the system was in the habit of rewarding both large parties anything like this equitably was in 1997 and since then it has been one way traffic to Labour.
With the headline out of the way its time to unpack. The skew has four distinct causes:
- Geographic distribution of votes
- Presence of minor parties in constituencies
- Different abstention rates
- Different constituency sizes

Graph 2 shows how the 4 different sources of skew have changed since 2005. It is important to note that these components of skew are independent and whilst one may be positive for a given party others may be negative for that party. It is clear from the graphs that the largest contributor to the overall skew in the system is vote distribution bias. Therefore I’ll describe how this distribution bias comes about, spell out the method that produced these results, and give a few caveats.
We can’t talk ex ante of skew and the biases that cause it and we can’t do so separate from a specific election. Each component part depends on the behaviour of voters. In the case of distribution bias the advantage or disadvantage that the system gives a party is determined by how efficiently its vote is ‘used’ to win seats. If a party wastes millions (literally) of votes which are cast in seats where it finishes second or third then this counts against it.
The way to calculate how a party is affected by the way in which its vote is distributed is to add up the results of hypothetical elections where each party swaps its vote share with its competitors. We can then see whether, with a given vote share Labour does relatively better than, say, the Conservatives with the same vote share.
By taking the predicted percentage vote for each party in each seat (produced by the www.electionforecast.co.uk team) and using the electorate and turnout figures for each constituency from 2010 we can analyse the bias at a hypothetical 2015 election as forecast by electionforecast and it is these calculations that produce the above figures for 2015.
For the existence of this method we have to thank a Kiwi political scientist, R. H. Brookes. The even more extraordinary feat of adapting the method to the three party case has to be credited to Galina Borisyuk in papers written with her colleagues at Plymouth Michael Thrasher and Colin Rallings.
Despite the fact that it seems that the two largest parties are being rewarded evenly by the electoral system in this election smaller parties whose vote is not supremely regionally concentrated are harshly treated by the current system. Chris Hanretty has run the numbers and found that, on the same forecast being used here, this will be the most disporportional election ever (with a Gallagher index value of 20.4). And it is this skew against UKIP, the Lib Dems and in favour of the SNP that is driving calls for electoral reform (although oddly sometimes from the two largest parties who are still benefiting).
Some caveats:
- The method used to derive the biases and skew is designed for 3 rather than 5 party politics. Anyone who can come up with a method for the n-party case gets themselves a published paper.
- We don’t know turnout in each seat as the election hasn’t been run. Therefore I have to just use the turnout from last time in each seat.
- The results are based on a forecast of each party’s vote share in each seat. It’s just a forecast and the result may be different (although I have faith in the forecast).
- I am grateful to Matt Singh for encouraging use of the term skew.
Note: This article gives the views of the author, and not the position of the General Election blog, nor of the London School of Economics. Please read our comments policy before posting.
Dr Tom Lubbock is Lecturer in Politics at Regent’s Park College, University of Oxford


Pretty! This has been a really wonderful article. Thanks for supplying these details.